
 Yahoo Finance
 Is OZ Minerals Limited’s (ASX:OZL) Return On Capital Employed Any Good?

Want to participate in a short research study? Help shape the future of investing tools and receive a $20 prize!
Today we are going to look at OZ Minerals Limited (ASX:OZL) to see whether it might be an attractive investment prospect. Specifically, we’re going to calculate its Return On Capital Employed (ROCE), in the hopes of getting some insight into the business.
First up, we’ll look at what ROCE is and how we calculate it. Next, we’ll compare it to others in its industry. Then we’ll determine how its current liabilities are affecting its ROCE.
Understanding Return On Capital Employed (ROCE)
ROCE measures the amount of pre-tax profits a company can generate from the capital employed in its business. All else being equal, a better business will have a higher ROCE. In brief, it is a useful tool, but it is not without drawbacks. Author Edwin Whiting says to be careful when comparing the ROCE of different businesses, since ‘No two businesses are exactly alike.’
So, How Do We Calculate ROCE?
Analysts use this formula to calculate return on capital employed:
Return on Capital Employed = Earnings Before Interest and Tax (EBIT) ÷ (Total Assets – Current Liabilities)
Or for OZ Minerals:
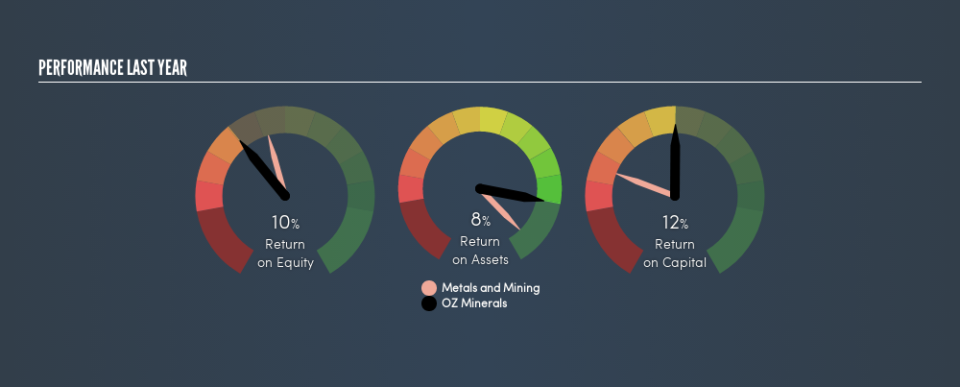
0.12 = AU$322m ÷ (AU$3.3b – AU$156m) (Based on the trailing twelve months to June 2018.)
Therefore, OZ Minerals has an ROCE of 12%.
See our latest analysis for OZ Minerals
Is OZ Minerals’s ROCE Good?
ROCE is commonly used for comparing the performance of similar businesses. Using our data, OZ Minerals’s ROCE appears to be around the 11% average of the Metals and Mining industry. Independently of how OZ Minerals compares to its industry, its ROCE in absolute terms appears decent, and the company may be worthy of closer investigation.
As we can see, OZ Minerals currently has an ROCE of 12% compared to its ROCE 3 years ago, which was 3.7%. This makes us think the business might be improving.
Remember that this metric is backwards looking – it shows what has happened in the past, and does not accurately predict the future. ROCE can be deceptive for cyclical businesses, as returns can look incredible in boom times, and terribly low in downturns. ROCE is only a point-in-time measure. Remember that most companies like OZ Minerals are cyclical businesses. Future performance is what matters, and you can see analyst predictions in our free report on analyst forecasts for the company.
Do OZ Minerals’s Current Liabilities Skew Its ROCE?
Current liabilities are short term bills and invoices that need to be paid in 12 months or less. The ROCE equation subtracts current liabilities from capital employed, so a company with a lot of current liabilities appears to have less capital employed, and a higher ROCE than otherwise. To counter this, investors can check if a company has high current liabilities relative to total assets.
OZ Minerals has total liabilities of AU$156m and total assets of AU$3.3b. As a result, its current liabilities are equal to approximately 4.7% of its total assets. In addition to low current liabilities (making a negligible impact on ROCE), OZ Minerals earns a sound return on capital employed.
Our Take On OZ Minerals’s ROCE
This is good to see, and while better prospects may exist, OZ Minerals seems worth researching further. Of course, you might find a fantastic investment by looking at a few good candidates. So take a peek at this free list of companies with modest (or no) debt, trading on a P/E below 20.
I will like OZ Minerals better if I see some big insider buys. While we wait, check out this free list of growing companies with considerable, recent, insider buying.
We aim to bring you long-term focused research analysis driven by fundamental data. Note that our analysis may not factor in the latest price-sensitive company announcements or qualitative material.
If you spot an error that warrants correction, please contact the editor at editorial-team@simplywallst.com. This article by Simply Wall St is general in nature. It does not constitute a recommendation to buy or sell any stock, and does not take account of your objectives, or your financial situation. Simply Wall St has no position in the stocks mentioned. Thank you for reading.
