
 Yahoo Finance
 Will Overstock.com (NASDAQ:OSTK) Multiply In Value Going Forward?

What trends should we look for it we want to identify stocks that can multiply in value over the long term? Typically, we'll want to notice a trend of growing return on capital employed (ROCE) and alongside that, an expanding base of capital employed. If you see this, it typically means it's a company with a great business model and plenty of profitable reinvestment opportunities. However, after investigating Overstock.com (NASDAQ:OSTK), we don't think it's current trends fit the mold of a multi-bagger.
What is Return On Capital Employed (ROCE)?
Just to clarify if you're unsure, ROCE is a metric for evaluating how much pre-tax income (in percentage terms) a company earns on the capital invested in its business. The formula for this calculation on Overstock.com is:
Return on Capital Employed = Earnings Before Interest and Tax (EBIT) ÷ (Total Assets - Current Liabilities)
0.025 = US$12m ÷ (US$843m - US$354m) (Based on the trailing twelve months to September 2020).
So, Overstock.com has an ROCE of 2.5%. Ultimately, that's a low return and it under-performs the Online Retail industry average of 9.4%.
See our latest analysis for Overstock.com
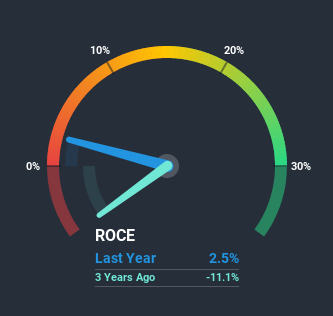
Above you can see how the current ROCE for Overstock.com compares to its prior returns on capital, but there's only so much you can tell from the past. If you'd like, you can check out the forecasts from the analysts covering Overstock.com here for free.
How Are Returns Trending?
The trend of ROCE doesn't look fantastic because it's fallen from 6.4% five years ago, while the business's capital employed increased by 214%. That being said, Overstock.com raised some capital prior to their latest results being released, so that could partly explain the increase in capital employed. Overstock.com probably hasn't received a full year of earnings yet from the new funds it raised, so these figures should be taken with a grain of salt.
On a side note, Overstock.com has done well to pay down its current liabilities to 42% of total assets. That could partly explain why the ROCE has dropped. What's more, this can reduce some aspects of risk to the business because now the company's suppliers or short-term creditors are funding less of its operations. Since the business is basically funding more of its operations with it's own money, you could argue this has made the business less efficient at generating ROCE. Either way, they're still at a pretty high level, so we'd like to see them fall further if possible.
The Bottom Line
In summary, despite lower returns in the short term, we're encouraged to see that Overstock.com is reinvesting for growth and has higher sales as a result. And the stock has done incredibly well with a 252% return over the last five years, so long term investors are no doubt ecstatic with that result. So while the underlying trends could already be accounted for by investors, we still think this stock is worth looking into further.
If you want to continue researching Overstock.com, you might be interested to know about the 4 warning signs that our analysis has discovered.
For those who like to invest in solid companies, check out this free list of companies with solid balance sheets and high returns on equity.
This article by Simply Wall St is general in nature. It does not constitute a recommendation to buy or sell any stock, and does not take account of your objectives, or your financial situation. We aim to bring you long-term focused analysis driven by fundamental data. Note that our analysis may not factor in the latest price-sensitive company announcements or qualitative material. Simply Wall St has no position in any stocks mentioned.
Have feedback on this article? Concerned about the content? Get in touch with us directly. Alternatively, email editorial-team@simplywallst.com.
