
 Yahoo Finance
 Is Orora Limited’s (ASX:ORA) Balance Sheet Strong Enough To Weather A Storm?

Stocks with market capitalization between $2B and $10B, such as Orora Limited (ASX:ORA) with a size of AU$4.10b, do not attract as much attention from the investing community as do the small-caps and large-caps. However, history shows that overlooked mid-cap companies have performed better on a risk-adjusted manner than the smaller and larger segment of the market. ORA’s financial liquidity and debt position will be analysed in this article, to get an idea of whether the company can fund opportunities for strategic growth and maintain strength through economic downturns. Remember this is a very top-level look that focuses exclusively on financial health, so I recommend a deeper analysis into ORA here.
View our latest analysis for Orora
How does ORA’s operating cash flow stack up against its debt?
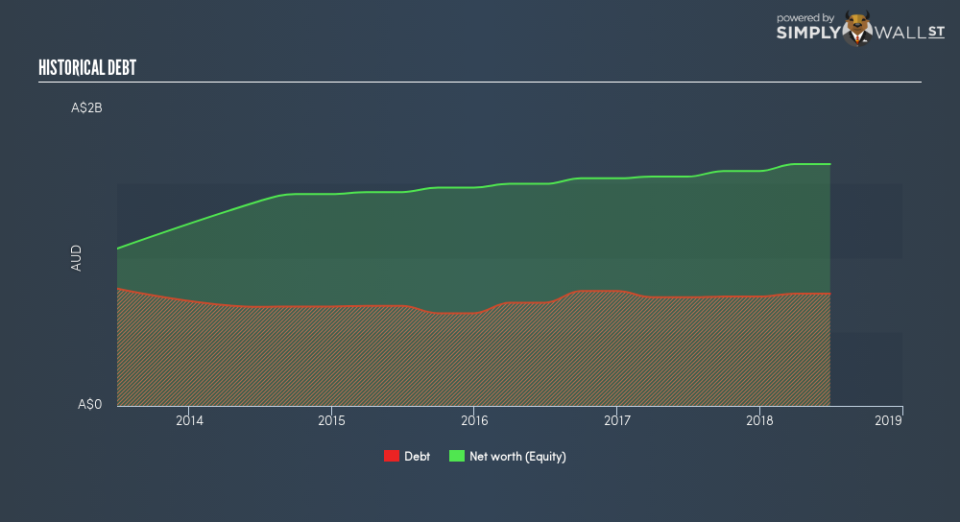
ORA’s debt level has been constant at around AU$757.7m over the previous year – this includes both the current and long-term debt. At this stable level of debt, the current cash and short-term investment levels stands at AU$87.6m for investing into the business. Moreover, ORA has produced cash from operations of AU$329.0m in the last twelve months, leading to an operating cash to total debt ratio of 43.4%, meaning that ORA’s operating cash is sufficient to cover its debt. This ratio can also be a sign of operational efficiency as an alternative to return on assets. In ORA’s case, it is able to generate 0.43x cash from its debt capital.
Can ORA pay its short-term liabilities?
With current liabilities at AU$1.10b, it appears that the company has maintained a safe level of current assets to meet its obligations, with the current ratio last standing at 1.2x. Usually, for Packaging companies, this is a suitable ratio since there’s sufficient cash cushion without leaving too much capital idle or in low-earning investments.
Can ORA service its debt comfortably?
With debt reaching 46.5% of equity, ORA may be thought of as relatively highly levered. This is not unusual for mid-caps as debt tends to be a cheaper and faster source of funding for some businesses. We can test if ORA’s debt levels are sustainable by measuring interest payments against earnings of a company. Ideally, earnings before interest and tax (EBIT) should cover net interest by at least three times. For ORA, the ratio of 9.4x suggests that interest is appropriately covered, which means that debtors may be willing to loan the company more money, giving ORA ample headroom to grow its debt facilities.
Next Steps:
Although ORA’s debt level is towards the higher end of the spectrum, its cash flow coverage seems adequate to meet obligations which means its debt is being efficiently utilised. This may mean this is an optimal capital structure for the business, given that it is also meeting its short-term commitment. Keep in mind I haven’t considered other factors such as how ORA has been performing in the past. You should continue to research Orora to get a better picture of the mid-cap by looking at:
Future Outlook: What are well-informed industry analysts predicting for ORA’s future growth? Take a look at our free research report of analyst consensus for ORA’s outlook.
Valuation: What is ORA worth today? Is the stock undervalued, even when its growth outlook is factored into its intrinsic value? The intrinsic value infographic in our free research report helps visualize whether ORA is currently mispriced by the market.
Other High-Performing Stocks: Are there other stocks that provide better prospects with proven track records? Explore our free list of these great stocks here.
To help readers see past the short term volatility of the financial market, we aim to bring you a long-term focused research analysis purely driven by fundamental data. Note that our analysis does not factor in the latest price-sensitive company announcements.
The author is an independent contributor and at the time of publication had no position in the stocks mentioned. For errors that warrant correction please contact the editor at editorial-team@simplywallst.com.
