
 Yahoo Finance
 Orica (ASX:ORI) May Have Issues Allocating Its Capital
When researching a stock for investment, what can tell us that the company is in decline? More often than not, we'll see a declining return on capital employed (ROCE) and a declining amount of capital employed. This reveals that the company isn't compounding shareholder wealth because returns are falling and its net asset base is shrinking. And from a first read, things don't look too good at Orica (ASX:ORI), so let's see why.
Return On Capital Employed (ROCE): What is it?
For those that aren't sure what ROCE is, it measures the amount of pre-tax profits a company can generate from the capital employed in its business. Analysts use this formula to calculate it for Orica:
Return on Capital Employed = Earnings Before Interest and Tax (EBIT) ÷ (Total Assets - Current Liabilities)
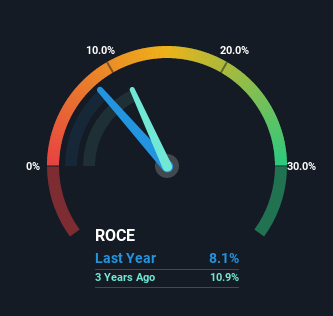
0.081 = AU$442m ÷ (AU$7.1b - AU$1.6b) (Based on the trailing twelve months to March 2022).
Therefore, Orica has an ROCE of 8.1%. In absolute terms, that's a low return, but it's much better than the Chemicals industry average of 5.5%.
Check out our latest analysis for Orica
Above you can see how the current ROCE for Orica compares to its prior returns on capital, but there's only so much you can tell from the past. If you'd like, you can check out the forecasts from the analysts covering Orica here for free.
What The Trend Of ROCE Can Tell Us
We are a bit worried about the trend of returns on capital at Orica. About five years ago, returns on capital were 11%, however they're now substantially lower than that as we saw above. Meanwhile, capital employed in the business has stayed roughly the flat over the period. Companies that exhibit these attributes tend to not be shrinking, but they can be mature and facing pressure on their margins from competition. So because these trends aren't typically conducive to creating a multi-bagger, we wouldn't hold our breath on Orica becoming one if things continue as they have.
In Conclusion...
In the end, the trend of lower returns on the same amount of capital isn't typically an indication that we're looking at a growth stock. Investors haven't taken kindly to these developments, since the stock has declined 17% from where it was five years ago. Unless there is a shift to a more positive trajectory in these metrics, we would look elsewhere.
Orica could be trading at an attractive price in other respects, so you might find our free intrinsic value estimation on our platform quite valuable.
While Orica may not currently earn the highest returns, we've compiled a list of companies that currently earn more than 25% return on equity. Check out this free list here.
Have feedback on this article? Concerned about the content? Get in touch with us directly. Alternatively, email editorial-team (at) simplywallst.com.
This article by Simply Wall St is general in nature. We provide commentary based on historical data and analyst forecasts only using an unbiased methodology and our articles are not intended to be financial advice. It does not constitute a recommendation to buy or sell any stock, and does not take account of your objectives, or your financial situation. We aim to bring you long-term focused analysis driven by fundamental data. Note that our analysis may not factor in the latest price-sensitive company announcements or qualitative material. Simply Wall St has no position in any stocks mentioned.
