
 Yahoo Finance
 If you only shop one Presidents Day deal, make it this robot vacuum for $120 off

Our team is dedicated to finding and telling you more about the products and deals we love. If you love them too and decide to purchase through the links below, we may receive a commission. Pricing and availability are subject to change.
Long holiday weekends call for relaxing and catching up on sleep, but it’s also one of the best times to shop. This year, retailers are dropping deals that rival Black Friday and Cyber Monday sales.
Typically, Presidents Day sales are full of discounts on major appliances and mattresses, but today you can expect to see deals on beauty products, bedding, kitchen gadgets and more.
Right now, one of the best places to take advantage of Presidents Day markdowns is Walmart. The big-box retailer’s sales always include can’t-miss prices. But this year, the deals are looking even better.
One of the best products you don’t want to miss from Walmart is the Anker eufy robot vacuum. It’s typically more than $200 — but right now, Walmart is selling the vacuum for just $129. That’s $120 in savings.
Shop: Anker eufy Wi-Fi-Connected Robot Vacuum, $129 (Orig. $249)

With more than 1,000 reviews, shoppers clearly love this robot vacuum. With this WiFi-powered vacuum, you don’t have to lift a finger to clean all of your floors — except to work the smartphone app, of course.
After connecting it to your home network, you can set up a cleaning routine or schedule cleanings. And if the vacuum gets stuck somewhere in your home, the app will even alert you. At a full charge, the vacuum can clean for up to 100 minutes, using its 1500PA suction power, while still keeping quiet thanks to its quiet-running brushless motor.
Not only do shoppers use it to pick up big dust bunnies, but it works great on pet hair, too.
“It picks up so much dust and hair; I have seven pets, and I’m amazed at how much pet hair it picked up,” one shopper writes. “I love this machine. It knows when it’s about to bump into something and turns itself before it bumps into a wall or door.”
While this robot vacuum deal is one of the best happening at Walmart right now, don’t forget to check out more of Walmart’s best Presidents Day deals below.
Shop: ionvacUV PureClean Hand Vac, $49.88 (Orig. $99)

Shop: Modern Sleep 14″ Cool Gel Memory Foam Mattress, $389+ (Orig. $799+)

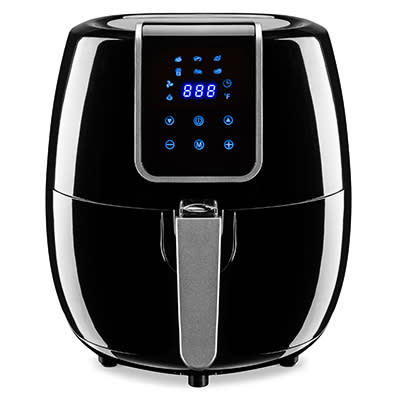
Shop: Best Choice Products Family-Sized Air Fryer, $69.99 (Orig. $177.99)
Shop: Yangming Racing Gaming Chair, $89.99 (Orig. $199.99)

Shop: TCL 32″ Roku Smart TV 3 Series, $138 (Orig. $199.99)

If you liked this story, read about Brooklinen’s sitewide Presidents Day sale with deals on all of its bedding.
More from In The Know:
Wayfair’s big Presidents Day sale is here with deals on Le Creuset, Bissell and more
All of the best Presidents Day tech deals to shop
7 of the best products to snag at Sephora’s rare Presidents Day sale
10 Presidents Day beauty sales you don’t want to miss
The post If you only shop one Presidents Day deal, make it this robot vacuum for $120 off appeared first on In The Know.
