
 Yahoo Finance
 The one-year returns for Rathbones Group's (LON:RAT) shareholders have been , yet its earnings growth was even better
Passive investing in index funds can generate returns that roughly match the overall market. But you can significantly boost your returns by picking above-average stocks. To wit, the Rathbones Group Plc (LON:RAT) share price is 25% higher than it was a year ago, much better than the market return of around 11% (not including dividends) in the same period. That's a solid performance by our standards! On the other hand, longer term shareholders have had a tougher run, with the stock falling 15% in three years.
Since the stock has added UK£48m to its market cap in the past week alone, let's see if underlying performance has been driving long-term returns.
View our latest analysis for Rathbones Group
To paraphrase Benjamin Graham: Over the short term the market is a voting machine, but over the long term it's a weighing machine. By comparing earnings per share (EPS) and share price changes over time, we can get a feel for how investor attitudes to a company have morphed over time.
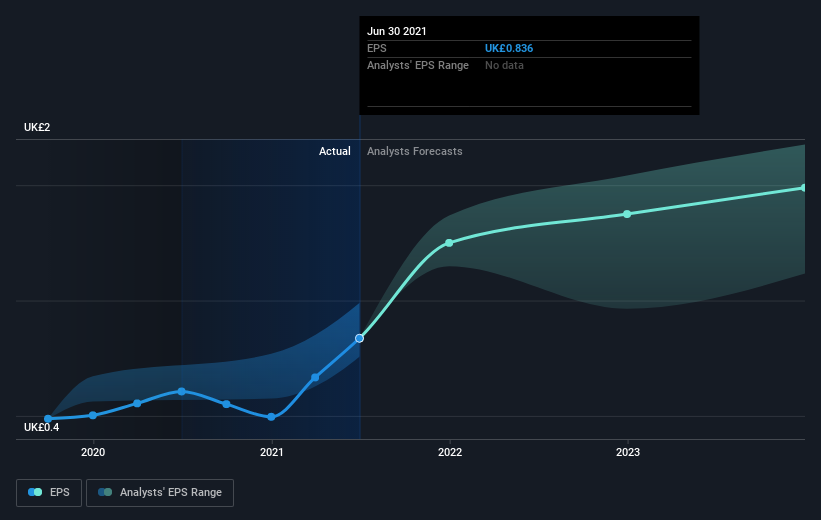
During the last year Rathbones Group grew its earnings per share (EPS) by 38%. This EPS growth is significantly higher than the 25% increase in the share price. So it seems like the market has cooled on Rathbones Group, despite the growth. Interesting.
You can see how EPS has changed over time in the image below (click on the chart to see the exact values).
We know that Rathbones Group has improved its bottom line lately, but is it going to grow revenue? This free report showing analyst revenue forecasts should help you figure out if the EPS growth can be sustained.
What About Dividends?
When looking at investment returns, it is important to consider the difference between total shareholder return (TSR) and share price return. The TSR is a return calculation that accounts for the value of cash dividends (assuming that any dividend received was reinvested) and the calculated value of any discounted capital raisings and spin-offs. So for companies that pay a generous dividend, the TSR is often a lot higher than the share price return. As it happens, Rathbones Group's TSR for the last 1 year was 30%, which exceeds the share price return mentioned earlier. The dividends paid by the company have thusly boosted the total shareholder return.
A Different Perspective
It's good to see that Rathbones Group has rewarded shareholders with a total shareholder return of 30% in the last twelve months. And that does include the dividend. That gain is better than the annual TSR over five years, which is 4%. Therefore it seems like sentiment around the company has been positive lately. In the best case scenario, this may hint at some real business momentum, implying that now could be a great time to delve deeper. While it is well worth considering the different impacts that market conditions can have on the share price, there are other factors that are even more important. Take risks, for example - Rathbones Group has 2 warning signs (and 1 which shouldn't be ignored) we think you should know about.
But note: Rathbones Group may not be the best stock to buy. So take a peek at this free list of interesting companies with past earnings growth (and further growth forecast).
Please note, the market returns quoted in this article reflect the market weighted average returns of stocks that currently trade on GB exchanges.
Have feedback on this article? Concerned about the content? Get in touch with us directly. Alternatively, email editorial-team (at) simplywallst.com.
This article by Simply Wall St is general in nature. We provide commentary based on historical data and analyst forecasts only using an unbiased methodology and our articles are not intended to be financial advice. It does not constitute a recommendation to buy or sell any stock, and does not take account of your objectives, or your financial situation. We aim to bring you long-term focused analysis driven by fundamental data. Note that our analysis may not factor in the latest price-sensitive company announcements or qualitative material. Simply Wall St has no position in any stocks mentioned.
