
 Yahoo Finance
 O-I Glass' (NYSE:OI) 316% YoY earnings expansion surpassed the shareholder returns over the past year
The simplest way to invest in stocks is to buy exchange traded funds. But if you pick the right individual stocks, you could make more than that. For example, the O-I Glass, Inc. (NYSE:OI) share price is up 56% in the last 1 year, clearly besting the market decline of around 9.1% (not including dividends). That's a solid performance by our standards! And shareholders have also done well over the long term, with an increase of 52% in the last three years.
The past week has proven to be lucrative for O-I Glass investors, so let's see if fundamentals drove the company's one-year performance.
See our latest analysis for O-I Glass
There is no denying that markets are sometimes efficient, but prices do not always reflect underlying business performance. By comparing earnings per share (EPS) and share price changes over time, we can get a feel for how investor attitudes to a company have morphed over time.
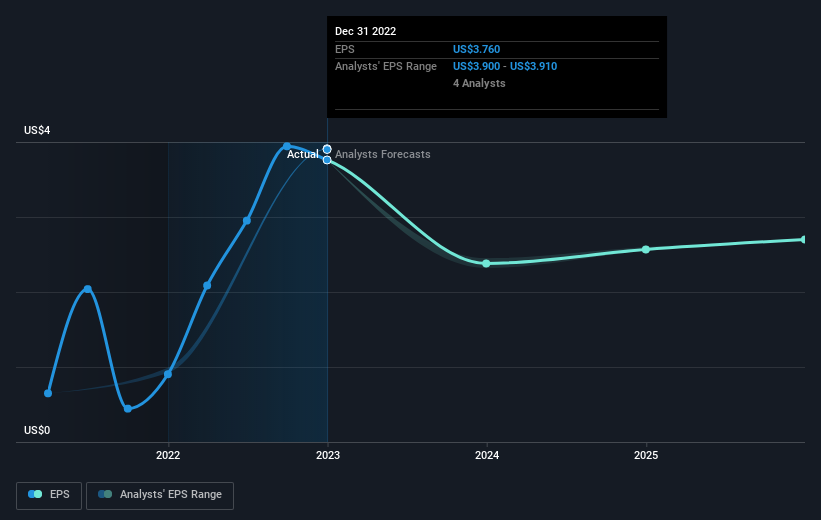
O-I Glass was able to grow EPS by 316% in the last twelve months. It's fair to say that the share price gain of 56% did not keep pace with the EPS growth. So it seems like the market has cooled on O-I Glass, despite the growth. Interesting. This cautious sentiment is reflected in its (fairly low) P/E ratio of 5.75.
The company's earnings per share (over time) is depicted in the image below (click to see the exact numbers).
We know that O-I Glass has improved its bottom line over the last three years, but what does the future have in store? This free interactive report on O-I Glass' balance sheet strength is a great place to start, if you want to investigate the stock further.
A Different Perspective
We're pleased to report that O-I Glass shareholders have received a total shareholder return of 56% over one year. Since the one-year TSR is better than the five-year TSR (the latter coming in at 0.6% per year), it would seem that the stock's performance has improved in recent times. Given the share price momentum remains strong, it might be worth taking a closer look at the stock, lest you miss an opportunity. While it is well worth considering the different impacts that market conditions can have on the share price, there are other factors that are even more important. For example, we've discovered 2 warning signs for O-I Glass that you should be aware of before investing here.
Of course, you might find a fantastic investment by looking elsewhere. So take a peek at this free list of companies we expect will grow earnings.
Please note, the market returns quoted in this article reflect the market weighted average returns of stocks that currently trade on US exchanges.
Have feedback on this article? Concerned about the content? Get in touch with us directly. Alternatively, email editorial-team (at) simplywallst.com.
This article by Simply Wall St is general in nature. We provide commentary based on historical data and analyst forecasts only using an unbiased methodology and our articles are not intended to be financial advice. It does not constitute a recommendation to buy or sell any stock, and does not take account of your objectives, or your financial situation. We aim to bring you long-term focused analysis driven by fundamental data. Note that our analysis may not factor in the latest price-sensitive company announcements or qualitative material. Simply Wall St has no position in any stocks mentioned.
Join A Paid User Research Session
You’ll receive a US$30 Amazon Gift card for 1 hour of your time while helping us build better investing tools for the individual investors like yourself. Sign up here
