
 Yahoo Finance
 NZD/USD Levels to Know Ahead of US June PCE Figures
DailyFX.com -
Talking Points:
- NZD/USD trading around resistance at the 0.72 handle area
- US PCE Figures and New-Zealand’s dairy auction numbers in focus ahead, longer term tech picture here
The NZD/USD is having difficulties around resistance levels at the 0.72 handle area, after the pair surged higher following Friday’s US 2Q GDP figures.
US PCE and New-Zealand’s dairy auction numbers are the main event risk on the docket for the pair in the hours ahead as the market awaits Friday’s NFP figures for further information on the US Economy.
Taking this into consideration, we look to find short term trading opportunities using the Grid Sight Index (GSI) indicator.
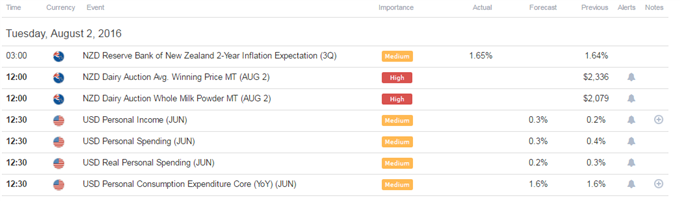
Click Here for the DailyFX Calendar
The New Zealand Dairy Auction is due to hit the wires around the start of US trading hours. The auction is set to start at 12:00 GMT, but official timing of the release varies, which might imply that short term traders should proceed with caution trading the pair at those hours.
The last auction saw the average price basically unchanged at $2,336. The dairy industry is New Zealand's biggest export earner, accounting for more than 29% of the country's exports, making this an important indicator to watch as falling dairy prices could potentially put pressure on the RBNZ to further cut rates.
With that said, the Kiwi might remain supported in this current environment after Friday’s weak US GDP figures seemed to have highlighted the yield differential between the currencies.
Even with the prospect of the central bank cutting rates, the RBNZ may be limited in their scope to lower rates on increasing risk of housing prices inflation, which seemed to have nudged the central bank to broaden LVR limits.
The US June PCE figures are set to hit the wires as well today. The Fed’s favored inflation gauge is expected to print 1.6% for the core year-on-year figure, unchanged from the prior print. Inflation has thus far been the “missing link” for the Fed’s mandate, and a beat to PCE figures expectations may push the US Dollar higher on that basis.
However, is seems like there might be a need to see a very substantial deviation from consensus for a significant market move as US Dollar traders could potentially hold back until Friday’s NFPs before further directional bets.
NZD/USD 5-Min GSI Chart: August 2, 2016
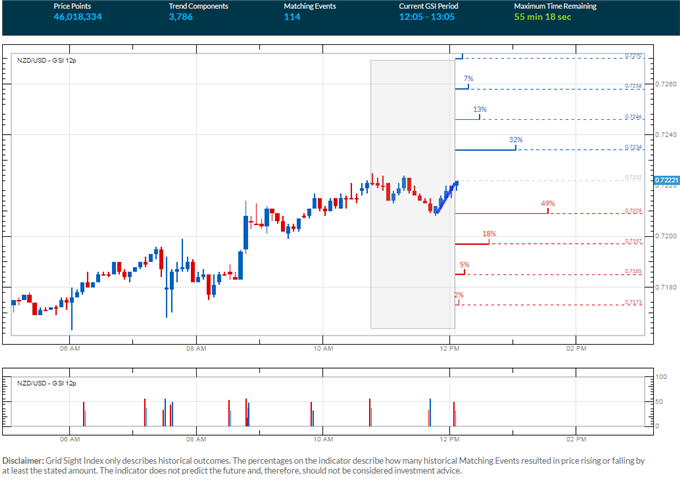
The NZD/USD is trading at a possible resistance area (see chart below), with GSI calculating higher percentage of past movement to the downside in the short term. The GSI indicator above calculates the distribution of past event outcomes given certain momentum patterns, and can give you a look at the market in a way that's never been possible before, analyzing millions of historical prices in real time. By matching events in the past, GSI describes how often the price moved in a certain direction.
You can learn more about the GSI here.
NZD/USD Technical Levels:

Click here for the DailyFX Support & Resistance tool
We use volatility measures as a way to better fit our strategy to market conditions. The NZD/USD is seeing slightly reduced levels of volatility (on 14-day ATR study). In turn, this could imply that range bound trading plays might be appropriate, but Friday’s US GDP miss seems like fertile ground for continued directional plays if US data continues to disappoint.
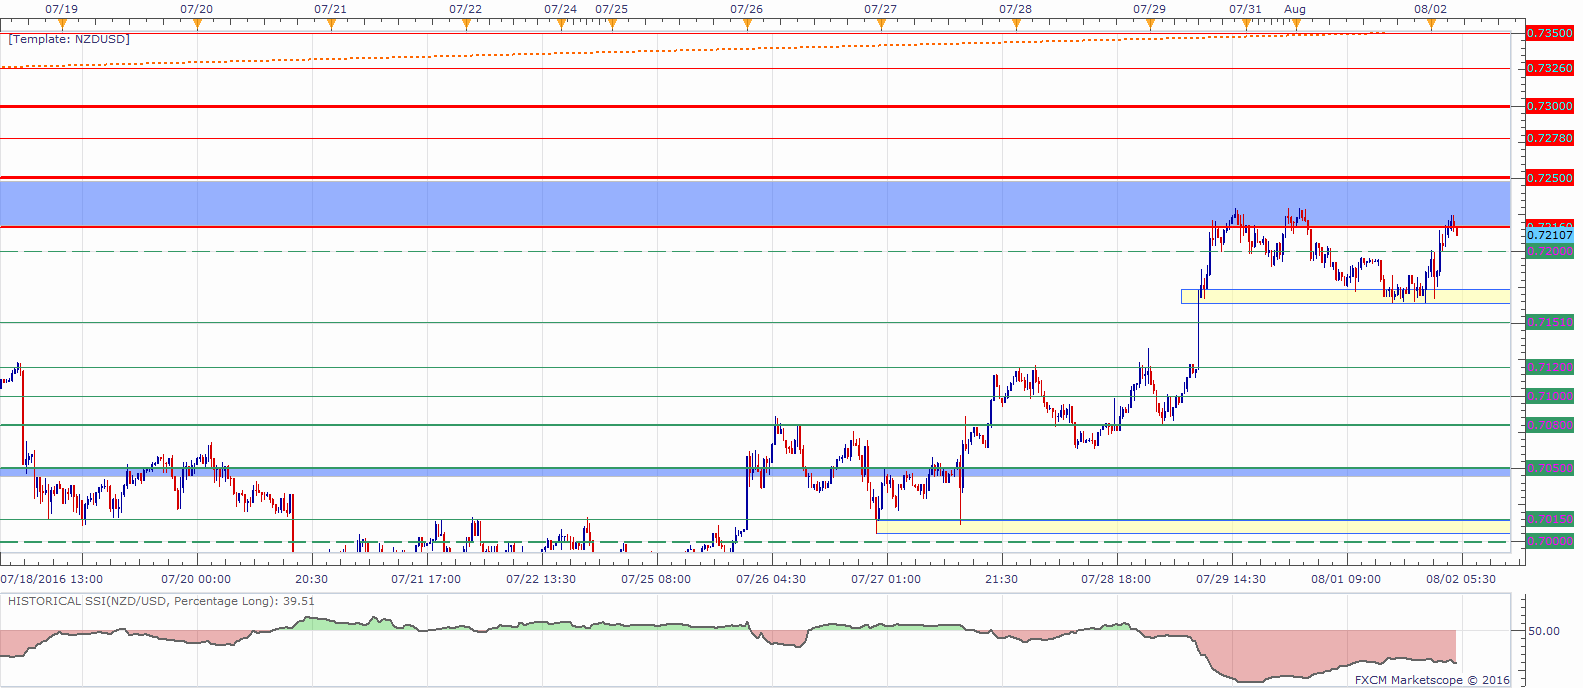
NZD/USD 30-Min Chart: August 2, 2016
(Click to Enlarge)
The NZD/USD is trading at an area of possible resistance with long term technical levels. The pair might need to see a clear move above 0.7250 for the Kiwi to really pick up speed.
Further levels of resistance on a move higher might be interim resistance at 0.7278, the 0.73 handle and the July high at 0.7326.
Levels of interest on a move lower could be 0.72, a support zone around 0.7175, 0.7150, 0.7120 and the 0.71 handle.
When price reaches those levels, short term traders might use the GSI to view how prices reacted in the past given a certain momentum pattern, and see the distribution of historical outcomes in which the price reversed or continued in the same direction. We generally want to see GSI with the historical patterns significantly shifted in one direction, which could potentially be used with a pre-determined bias as well.
A common way to use GSI is to help you fade tops and bottoms, and trade breakouts. That’s why traders may want to use the GSI indicator when price reaches those specific pre-determined levels, and fit a strategy that can offer a proper way to define risk. We studied over 43 million real trades and found that traders who do that were three times more likely to turn a profit. Read more on the “Traits of Successful Traders” research.
Meanwhile, the DailyFX Speculative Sentiment Index (SSI) is showing that about 39.5% of FXCM’s traders are long the NZD/USD at the time of writing. The SSI is mainly used as a contrarian indicator implying a long bias.
You can find more info about the DailyFX SSI indicator here
--- Written by Oded Shimoni, Junior Currency Analyst for DailyFX.com
To contact Oded Shimoni, e-mail oshimoni@dailyfx.com
Follow him on Twitter at @OdedShimoni
DailyFX provides forex news and technical analysis on the trends that influence the global currency markets.
Learn forex trading with a free practice account and trading charts from FXCM.