
 Yahoo Finance
 NZD/USD Forex Technical Analysis – Trade Through .6596 Confirms Weekly Closing Price Reversal Bottom
The New Zealand Dollar posted a potentially bullish closing price reversal bottom last week. A follow-through to the upside through last week’s high at .6596 will confirm the chart pattern. This could lead to the start of a 2 to 3 week counter-trend rally.
Last week, the NZD/USD settled at .6546, up 0.0012 or +0.19%.
The Kiwi was supported by a weaker U.S. Dollar early in the week amid reports of weaker-than-expected U.S. producer and consumer inflation. A report that the U.S. had invited China to resume trade talks also contributed to the short-covering rally.
However, the NZD/USD game back some of its gains last in the week after a sharp rise in U.S. Treasury yields made the U.S. Dollar a more attractive investment and President Trump said he would impose new tariffs on China.
This week’s key report is New Zealand GDP. The quarterly number is expected to show an increase of 0.8%.
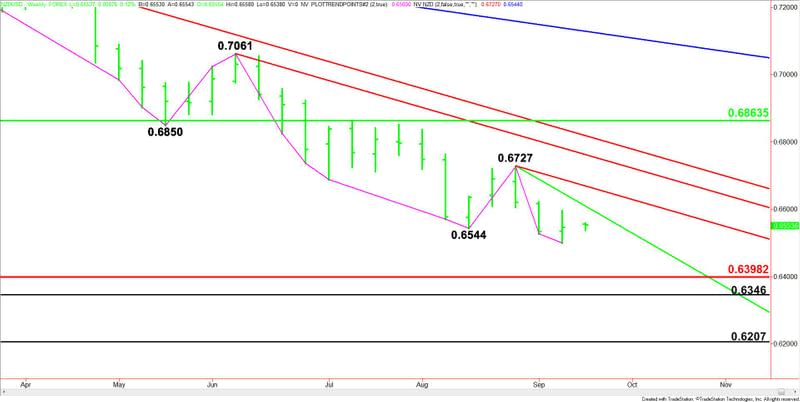
Weekly Technical Analysis
The main trend is down according to the weekly swing chart. A trade through .6500 will negate the closing price reversal bottom and signal a resumption of the downtrend. A trade through .6727 will change the main trend to up.
The longer-term range is formed by the March 2009 bottom at .4892 to the July 2014 top at .8835. The NZD/USD is currently trading inside its retracement zone at .6864 to .6398. This zone is controlling the longer-term direction of the Forex pair.
Weekly Technical Forecast
Based on last week’s price action, the direction of the NZD/USD will be determined by trader reaction to last week’s high at .6596 and a short-term downtrending Gann angle at .6607.
A sustained move under .6596 will indicate the presence of sellers. It will also mean that sellers are trying to prevent the confirmation of the closing price reversal bottom.
Taking out .6596 will negate the reversal bottom and signal a resumption of the downtrend. This could trigger an acceleration to the downside with the long-term Fibonacci level at .6398 the next downside target.
Overcoming .6596 will confirm the closing price reversal bottom. However, taking out the short-term downtrending Gann angle at .6607 is likely to trigger an acceleration to the upside with the next target a downtrending Gann angle at .6667. This is the last potential resistance angle before the .6727 main top.
Breaking through .6727 will change the main trend to up. This could fuel a rally into the long-term downtrending Gann angle at .6817.
This article was originally posted on FX Empire
