
 Yahoo Finance
 NVE Corporation (NASDAQ:NVEC) Is Going Strong But Fundamentals Appear To Be Mixed : Is There A Clear Direction For The Stock?
NVE's (NASDAQ:NVEC) stock is up by a considerable 35% over the past three months. However, we wonder if the company's inconsistent financials would have any adverse impact on the current share price momentum. Particularly, we will be paying attention to NVE's ROE today.
Return on Equity or ROE is a test of how effectively a company is growing its value and managing investors’ money. Simply put, it is used to assess the profitability of a company in relation to its equity capital.
See our latest analysis for NVE
How To Calculate Return On Equity?
The formula for ROE is:
Return on Equity = Net Profit (from continuing operations) ÷ Shareholders' Equity
So, based on the above formula, the ROE for NVE is:
27% = US$18m ÷ US$64m (Based on the trailing twelve months to September 2022).
The 'return' is the amount earned after tax over the last twelve months. So, this means that for every $1 of its shareholder's investments, the company generates a profit of $0.27.
What Has ROE Got To Do With Earnings Growth?
So far, we've learned that ROE is a measure of a company's profitability. Depending on how much of these profits the company reinvests or "retains", and how effectively it does so, we are then able to assess a company’s earnings growth potential. Generally speaking, other things being equal, firms with a high return on equity and profit retention, have a higher growth rate than firms that don’t share these attributes.
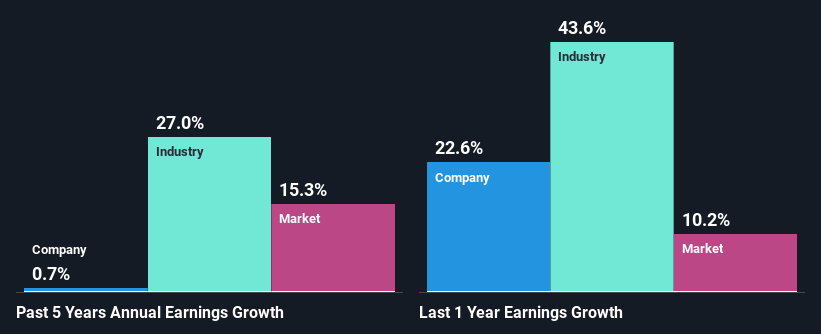
A Side By Side comparison of NVE's Earnings Growth And 27% ROE
First thing first, we like that NVE has an impressive ROE. Second, a comparison with the average ROE reported by the industry of 19% also doesn't go unnoticed by us. Given the circumstances, we can't help but wonder why NVE saw little to no growth in the past five years. We reckon that there could be some other factors at play here that's limiting the company's growth. These include low earnings retention or poor allocation of capital
We then compared NVE's net income growth with the industry and found that the company's growth figure is lower than the average industry growth rate of 27% in the same period, which is a bit concerning.
Earnings growth is a huge factor in stock valuation. The investor should try to establish if the expected growth or decline in earnings, whichever the case may be, is priced in. By doing so, they will have an idea if the stock is headed into clear blue waters or if swampy waters await. Is NVE fairly valued compared to other companies? These 3 valuation measures might help you decide.
Is NVE Making Efficient Use Of Its Profits?
NVE has a very high three-year median payout ratio of 140% over the last last three years, which suggests that the company is dipping into more than just its earnings to pay its dividend. The absence of growth in NVE's earnings therefore, doesn't come as a surprise. Paying a dividend higher than reported profits is not a sustainable move. That's a huge risk in our books.
Moreover, NVE has been paying dividends for eight years, which is a considerable amount of time, suggesting that management must have perceived that the shareholders prefer dividends over earnings growth.
Conclusion
Overall, we have mixed feelings about NVE. In spite of the high ROE, the company has failed to see growth in its earnings due to it paying out most of its profits as dividend, with almost nothing left to invest into its own business. So far, we've only made a quick discussion around the company's earnings growth. You can do your own research on NVE and see how it has performed in the past by looking at this FREE detailed graph of past earnings, revenue and cash flows.
Have feedback on this article? Concerned about the content? Get in touch with us directly. Alternatively, email editorial-team (at) simplywallst.com.
This article by Simply Wall St is general in nature. We provide commentary based on historical data and analyst forecasts only using an unbiased methodology and our articles are not intended to be financial advice. It does not constitute a recommendation to buy or sell any stock, and does not take account of your objectives, or your financial situation. We aim to bring you long-term focused analysis driven by fundamental data. Note that our analysis may not factor in the latest price-sensitive company announcements or qualitative material. Simply Wall St has no position in any stocks mentioned.
Join A Paid User Research Session
You’ll receive a US$30 Amazon Gift card for 1 hour of your time while helping us build better investing tools for the individual investors like yourself. Sign up here
