
 Yahoo Finance
 NOV (NYSE:NOV) Might Have The Makings Of A Multi-Bagger
What are the early trends we should look for to identify a stock that could multiply in value over the long term? Firstly, we'll want to see a proven return on capital employed (ROCE) that is increasing, and secondly, an expanding base of capital employed. Put simply, these types of businesses are compounding machines, meaning they are continually reinvesting their earnings at ever-higher rates of return. Speaking of which, we noticed some great changes in NOV's (NYSE:NOV) returns on capital, so let's have a look.
Return On Capital Employed (ROCE): What Is It?
If you haven't worked with ROCE before, it measures the 'return' (pre-tax profit) a company generates from capital employed in its business. The formula for this calculation on NOV is:
Return on Capital Employed = Earnings Before Interest and Tax (EBIT) ÷ (Total Assets - Current Liabilities)
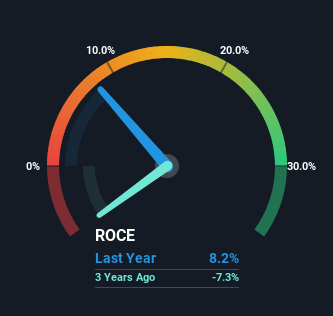
0.082 = US$738m ÷ (US$11b - US$2.3b) (Based on the trailing twelve months to March 2024).
Thus, NOV has an ROCE of 8.2%. Ultimately, that's a low return and it under-performs the Energy Services industry average of 12%.
Check out our latest analysis for NOV
In the above chart we have measured NOV's prior ROCE against its prior performance, but the future is arguably more important. If you'd like, you can check out the forecasts from the analysts covering NOV for free.
The Trend Of ROCE
You'd find it hard not to be impressed with the ROCE trend at NOV. The figures show that over the last five years, returns on capital have grown by 792%. That's not bad because this tells for every dollar invested (capital employed), the company is increasing the amount earned from that dollar. Interestingly, the business may be becoming more efficient because it's applying 50% less capital than it was five years ago. NOV may be selling some assets so it's worth investigating if the business has plans for future investments to increase returns further still.
In Conclusion...
In the end, NOV has proven it's capital allocation skills are good with those higher returns from less amount of capital. And given the stock has remained rather flat over the last five years, there might be an opportunity here if other metrics are strong. That being the case, research into the company's current valuation metrics and future prospects seems fitting.
One more thing to note, we've identified 1 warning sign with NOV and understanding this should be part of your investment process.
If you want to search for solid companies with great earnings, check out this free list of companies with good balance sheets and impressive returns on equity.
Have feedback on this article? Concerned about the content? Get in touch with us directly. Alternatively, email editorial-team (at) simplywallst.com.
This article by Simply Wall St is general in nature. We provide commentary based on historical data and analyst forecasts only using an unbiased methodology and our articles are not intended to be financial advice. It does not constitute a recommendation to buy or sell any stock, and does not take account of your objectives, or your financial situation. We aim to bring you long-term focused analysis driven by fundamental data. Note that our analysis may not factor in the latest price-sensitive company announcements or qualitative material. Simply Wall St has no position in any stocks mentioned.
