
 Yahoo Finance
 The Northeast Bancorp (NASDAQ:NBN) Share Price Is Up 119% And Shareholders Are Boasting About It

Want to participate in a research study? Help shape the future of investing tools and earn a $60 gift card!
When you buy a stock there is always a possibility that it could drop 100%. But on the bright side, you can make far more than 100% on a really good stock. One great example is Northeast Bancorp (NASDAQ:NBN) which saw its share price drive 119% higher over five years. On top of that, the share price is up 26% in about a quarter. But this could be related to the strong market, which is up 18% in the last three months.
View our latest analysis for Northeast Bancorp
There is no denying that markets are sometimes efficient, but prices do not always reflect underlying business performance. One way to examine how market sentiment has changed over time is to look at the interaction between a company’s share price and its earnings per share (EPS).
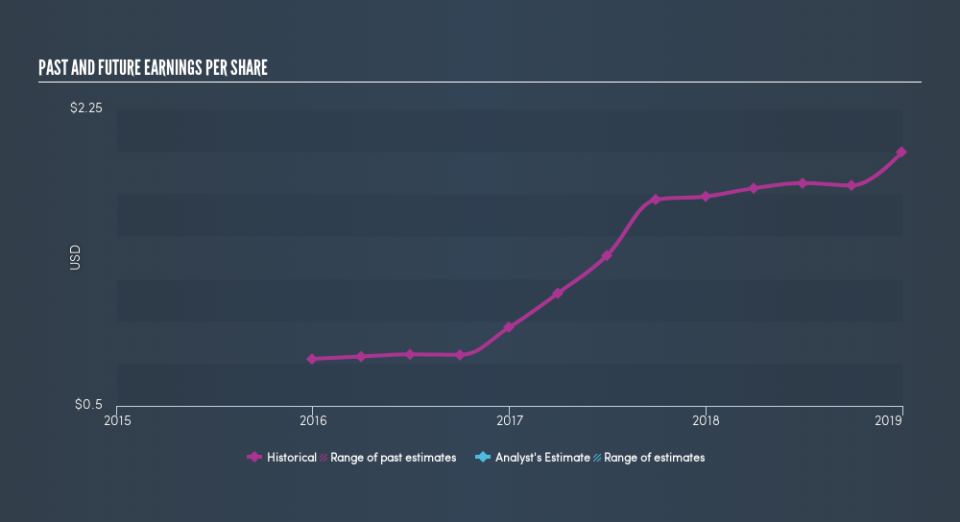
During five years of share price growth, Northeast Bancorp achieved compound earnings per share (EPS) growth of 42% per year. The EPS growth is more impressive than the yearly share price gain of 17% over the same period. Therefore, it seems the market has become relatively pessimistic about the company. This cautious sentiment is reflected in its (fairly low) P/E ratio of 10.25.
The image below shows how EPS has tracked over time (if you click on the image you can see greater detail).
We like that insiders have been buying shares in the last twelve months. Having said that, most people consider earnings and revenue growth trends to be a more meaningful guide to the business. This free interactive report on Northeast Bancorp’s earnings, revenue and cash flow is a great place to start, if you want to investigate the stock further.
What About Dividends?
When looking at investment returns, it is important to consider the difference between total shareholder return (TSR) and share price return. Whereas the share price return only reflects the change in the share price, the TSR includes the value of dividends (assuming they were reinvested) and the benefit of any discounted capital raising or spin-off. It’s fair to say that the TSR gives a more complete picture for stocks that pay a dividend. In the case of Northeast Bancorp, it has a TSR of 122% for the last 5 years. That exceeds its share price return that we previously mentioned. This is largely a result of its dividend payments!
A Different Perspective
Investors in Northeast Bancorp had a tough year, with a total loss of 3.5% (including dividends), against a market gain of about 6.3%. However, keep in mind that even the best stocks will sometimes underperform the market over a twelve month period. Longer term investors wouldn’t be so upset, since they would have made 17%, each year, over five years. If the fundamental data continues to indicate long term sustainable growth, the current sell-off could be an opportunity worth considering. If you want to research this stock further, the data on insider buying is an obvious place to start. You can click here to see who has been buying shares – and the price they paid.
There are plenty of other companies that have insiders buying up shares. You probably do not want to miss this free list of growing companies that insiders are buying.
Please note, the market returns quoted in this article reflect the market weighted average returns of stocks that currently trade on US exchanges.
We aim to bring you long-term focused research analysis driven by fundamental data. Note that our analysis may not factor in the latest price-sensitive company announcements or qualitative material.
If you spot an error that warrants correction, please contact the editor at editorial-team@simplywallst.com. This article by Simply Wall St is general in nature. It does not constitute a recommendation to buy or sell any stock, and does not take account of your objectives, or your financial situation. Simply Wall St has no position in the stocks mentioned. Thank you for reading.
