
 Yahoo Finance
 Are Noni B Limited’s (ASX:NBL) Returns Worth Your While?

Today we'll look at Noni B Limited (ASX:NBL) and reflect on its potential as an investment. In particular, we'll consider its Return On Capital Employed (ROCE), as that can give us insight into how profitably the company is able to employ capital in its business.
First of all, we'll work out how to calculate ROCE. Next, we'll compare it to others in its industry. Finally, we'll look at how its current liabilities affect its ROCE.
Understanding Return On Capital Employed (ROCE)
ROCE is a metric for evaluating how much pre-tax income (in percentage terms) a company earns on the capital invested in its business. Generally speaking a higher ROCE is better. Ultimately, it is a useful but imperfect metric. Author Edwin Whiting says to be careful when comparing the ROCE of different businesses, since 'No two businesses are exactly alike.'
How Do You Calculate Return On Capital Employed?
Analysts use this formula to calculate return on capital employed:
Return on Capital Employed = Earnings Before Interest and Tax (EBIT) ÷ (Total Assets - Current Liabilities)
Or for Noni B:
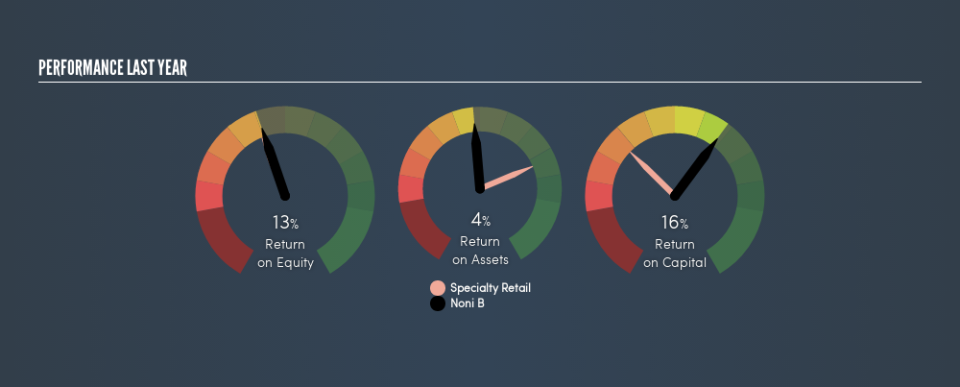
0.16 = AU$29m ÷ (AU$432m - AU$256m) (Based on the trailing twelve months to December 2018.)
So, Noni B has an ROCE of 16%.
Check out our latest analysis for Noni B
Does Noni B Have A Good ROCE?
ROCE can be useful when making comparisons, such as between similar companies. Using our data, Noni B's ROCE appears to be around the 15% average of the Specialty Retail industry. Regardless of where Noni B sits next to its industry, its ROCE in absolute terms appears satisfactory, and this company could be worth a closer look.
As we can see, Noni B currently has an ROCE of 16% compared to its ROCE 3 years ago, which was 6.5%. This makes us think about whether the company has been reinvesting shrewdly.
When considering this metric, keep in mind that it is backwards looking, and not necessarily predictive. ROCE can be misleading for companies in cyclical industries, with returns looking impressive during the boom times, but very weak during the busts. ROCE is only a point-in-time measure. What happens in the future is pretty important for investors, so we have prepared a free report on analyst forecasts for Noni B.
How Noni B's Current Liabilities Impact Its ROCE
Current liabilities are short term bills and invoices that need to be paid in 12 months or less. Due to the way the ROCE equation works, having large bills due in the near term can make it look as though a company has less capital employed, and thus a higher ROCE than usual. To counteract this, we check if a company has high current liabilities, relative to its total assets.
Noni B has total liabilities of AU$256m and total assets of AU$432m. As a result, its current liabilities are equal to approximately 59% of its total assets. This is admittedly a high level of current liabilities, improving ROCE substantially.
What We Can Learn From Noni B's ROCE
The ROCE would not look as appealing if the company had fewer current liabilities. Noni B shapes up well under this analysis, but it is far from the only business delivering excellent numbers . You might also want to check this free collection of companies delivering excellent earnings growth.
I will like Noni B better if I see some big insider buys. While we wait, check out this free list of growing companies with considerable, recent, insider buying.
We aim to bring you long-term focused research analysis driven by fundamental data. Note that our analysis may not factor in the latest price-sensitive company announcements or qualitative material.
If you spot an error that warrants correction, please contact the editor at editorial-team@simplywallst.com. This article by Simply Wall St is general in nature. It does not constitute a recommendation to buy or sell any stock, and does not take account of your objectives, or your financial situation. Simply Wall St has no position in the stocks mentioned. Thank you for reading.
