
 Yahoo Finance
 NiSource Inc. (NYSE:NI) Might Not Be A Great Investment

Today we'll look at NiSource Inc. (NYSE:NI) and reflect on its potential as an investment. To be precise, we'll consider its Return On Capital Employed (ROCE), as that will inform our view of the quality of the business.
Firstly, we'll go over how we calculate ROCE. Next, we'll compare it to others in its industry. Last but not least, we'll look at what impact its current liabilities have on its ROCE.
Return On Capital Employed (ROCE): What is it?
ROCE measures the 'return' (pre-tax profit) a company generates from capital employed in its business. In general, businesses with a higher ROCE are usually better quality. In brief, it is a useful tool, but it is not without drawbacks. Renowned investment researcher Michael Mauboussin has suggested that a high ROCE can indicate that 'one dollar invested in the company generates value of more than one dollar'.
How Do You Calculate Return On Capital Employed?
Analysts use this formula to calculate return on capital employed:
Return on Capital Employed = Earnings Before Interest and Tax (EBIT) ÷ (Total Assets - Current Liabilities)
Or for NiSource:
0.017 = US$311m ÷ (US$22b - US$3.3b) (Based on the trailing twelve months to September 2019.)
So, NiSource has an ROCE of 1.7%.
Check out our latest analysis for NiSource
Is NiSource's ROCE Good?
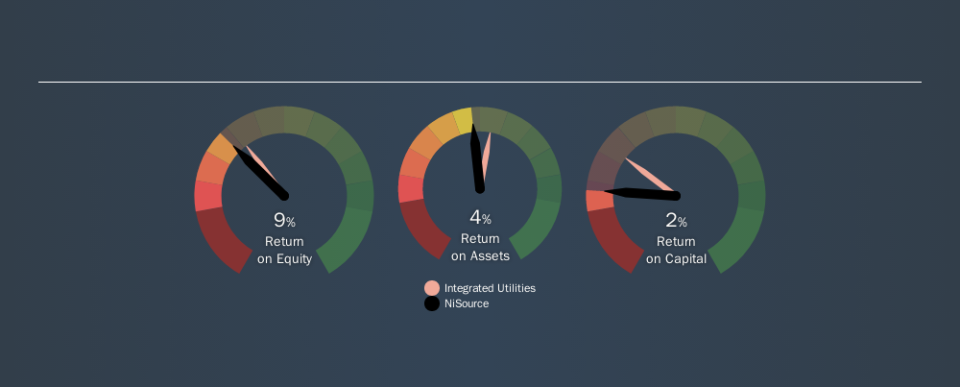
One way to assess ROCE is to compare similar companies. In this analysis, NiSource's ROCE appears meaningfully below the 4.9% average reported by the Integrated Utilities industry. This performance could be negative if sustained, as it suggests the business may underperform its industry. Independently of how NiSource compares to its industry, its ROCE in absolute terms is low; especially compared to the ~2.7% available in government bonds. Readers may wish to look for more rewarding investments.
NiSource's current ROCE of 1.7% is lower than its ROCE in the past, which was 5.6%, 3 years ago. This makes us wonder if the business is facing new challenges. You can click on the image below to see (in greater detail) how NiSource's past growth compares to other companies.
It is important to remember that ROCE shows past performance, and is not necessarily predictive. ROCE can be misleading for companies in cyclical industries, with returns looking impressive during the boom times, but very weak during the busts. ROCE is only a point-in-time measure. Future performance is what matters, and you can see analyst predictions in our free report on analyst forecasts for the company.
Do NiSource's Current Liabilities Skew Its ROCE?
Short term (or current) liabilities, are things like supplier invoices, overdrafts, or tax bills that need to be paid within 12 months. The ROCE equation subtracts current liabilities from capital employed, so a company with a lot of current liabilities appears to have less capital employed, and a higher ROCE than otherwise. To counter this, investors can check if a company has high current liabilities relative to total assets.
NiSource has total assets of US$22b and current liabilities of US$3.3b. As a result, its current liabilities are equal to approximately 15% of its total assets. This is a modest level of current liabilities, which will have a limited impact on the ROCE.
Our Take On NiSource's ROCE
NiSource has a poor ROCE, and there may be better investment prospects out there. Of course, you might find a fantastic investment by looking at a few good candidates. So take a peek at this free list of companies with modest (or no) debt, trading on a P/E below 20.
If you are like me, then you will not want to miss this free list of growing companies that insiders are buying.
We aim to bring you long-term focused research analysis driven by fundamental data. Note that our analysis may not factor in the latest price-sensitive company announcements or qualitative material.
If you spot an error that warrants correction, please contact the editor at editorial-team@simplywallst.com. This article by Simply Wall St is general in nature. It does not constitute a recommendation to buy or sell any stock, and does not take account of your objectives, or your financial situation. Simply Wall St has no position in the stocks mentioned. Thank you for reading.
