
 Yahoo Finance
 Nikkei 225 Technical Analysis: Still Attempt to Break Resistance
DailyFX.com -
Talking Points:
Nikkei 225 Strategy: Prepare for bullish trade if resistance is broken
Price action around 76.4% Fibonacci and support trend line are hints to upcoming direction
Upward momentum supports Nikkei’s attempts to re-test yearly high
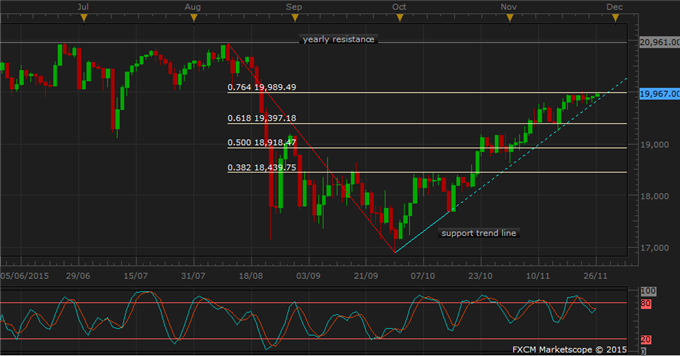
The Nikkei 225 index has been testing a resistance level at 19,989.4, also 76.4% Fibonacci of the August-September decline. In the one-year chart below, price action nearly formed a symmetrical triangle with 2 months of decline (August-September) followed by 2 months of rebound (October- November).
Long-term boundaries of the index are: yearly support level at 16430.4 which has held since last November; and yearly resistance level at 20.961, also a triple top during June, July, August rallies.

The zoom-in chart below displays its steep climb since September 30 while downside complied with a support trend line. Currently at 19,835, this support trend line indicates an inherent bullish momentum even as daily prices recorded small corrections along the way.
The most important level to watch is 76.4% Fibonacci resistance, which holds the gate between current price levels and the area above that onto yearly resistance. Nikkei has been testing this level since November 18.
Bull traders with long positions should keep watch of both the Fibonacci resistance and support trend line for hints of further ascent or a reversal. Other traders could wait for a break of resistance before considering long positions. Downside remains limited.
Losing Money Trading Forex? This Might Be Why.
DailyFX provides forex news and technical analysis on the trends that influence the global currency markets.
Learn forex trading with a free practice account and trading charts from FXCM.
