
 Yahoo Finance
 Newell Brands (NWL) Beats on Q2 Earnings, Lifts '21 Sales View
Newell Brands Inc. NWL posted sturdy second-quarter 2021 results wherein both the top and the bottom line improved year over year and beat the Zacks Consensus Estimate. Results also surpassed management’s expectations. Despite the challenges related to inflationary and supply-chain pressures, results reflected solid growth across all the business units and major geographic regions.
Driven by the impressive first-half 2021 results, management lifted sales guidance for the current year and reiterated normalized earnings per share view for the current year. It also issued outlook for the third quarter.
Over the past six months, this presently Zacks Rank #3 (Hold) stock has gained 22.4% compared with the industry’s 11.5% growth.
Q2 Highlights
Newell Brands’ second-quarter normalized earnings per share were 56 cents, which outpaced the Zacks Consensus Estimate of 45 cents. The metric also surged 86.7% from 30 cents earned a year ago. Higher sales and margins fueled the bottom-line performance.
Net sales grew 28.3% year over year to $2,709 million and surpassed the Zacks Consensus Estimate of $2,551 million. The uptick can be attributed to favorable foreign currency movements and core sales growth of 25.4% as every business unit and key regions witnessed higher core sales. The metric was offset by the adverse impacts of business and retail store exits. Net sales grew 9.2% from the second-quarter 2019 level.
Newell Brands Inc. Price, Consensus and EPS Surprise
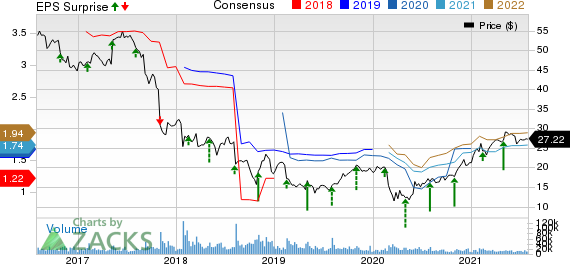
Newell Brands Inc. price-consensus-eps-surprise-chart | Newell Brands Inc. Quote
Normalized gross margin expanded 110 basis points (bps) year over year to 32.7%. Normalized operating margin expanded 240 bps to 12.6% year over year.
Segment Details
The Home Appliances segment recorded net sales of $394 million in the second quarter, up 19.4% from the prior-year quarter’s tally. This upside is owing to the segment’s core sales growth of 15.3% and foreign exchange tailwinds.
Net sales at the Home Solutions segment (Food, Outdoor products, Home Fragrance, and Connected Home & Security) totaled $525 million, up 36.7% from the prior-year period’s number. The segment’s top line was mainly fueled by core sales growth of 33.7% and positive foreign exchange impacts. Also, both the Food and Home Fragrance businesses witnessed higher core sales.
The Learnings and Development segment recorded net sales of $844 million, which grew 33.8% from the prior-year quarter’s reading. This uptrend is led by a 31.6% rise in core sales resulting from strength in both Writing and Baby units.
Net sales in the Commercial Solution segment were $493 million, up 19.4% from the prior-year period’s number. Core sales growth of 16.6%, driven by a solid performance across both the Commercial and the Connected Home & Security business divisions as well as favorable foreign exchange impacts, aided the segment’s top line.
The Outdoor and Recreation segment recorded net sales of $453 million, which increased 28.3% from the prior-year quarter’s level. This resulted from core sales growth of 25% year over year and foreign exchange tailwinds.
Other Financial Details
Newell Brands ended the quarter with cash and cash equivalents of $637 million, long-term debt of $4,885 million and shareholders’ equity of $3,986 million excluding non-controlling interests of $25 million.
For the quarter ended Jun 30 2021, the company generated $76 million in operating activities. It paid out dividends worth $198 million during the first half of 2021. It has liquidity of more than $2 billion, which is likely to help it stay afloat amid this crisis.
Outlook
Management revised 2021 view to account for greater-than-expected demand, robust productivity savings and an unprecedented rise in inflation. The company now anticipates 2021 sales at $10.1-$10.35 billion compared with the earlier view of $9.9-$10.1 billion. Core sales growth is likely to be 7-10%, up from the prior projection of 5-7%. Normalized operating margin is likely to come in at 11.1% and normalized earnings per share are still forecast at $1.63-$1.73 for the year. The Zacks Consensus Estimate for 2021 sales and earnings is currently pegged at $10.15 billion and $1.74, respectively. The company envisions generating an operating cash flow of $1 billion.
For third-quarter 2021, net sales are envisioned to be $2.7-$2.78 billion with core sales ranging from flat to up 3% year over year. For the same quarter, the company expects a normalized operating margin of 10.3-10.8% and normalized earnings of 46-50 cents a share. The Zacks Consensus Estimate for third-quarter 2021 sales and earnings is currently pegged at $2.61 billion and 55 cents, respectively.
Stocks to Consider
Chewy CHWY has an expected long-term earnings growth rate of 20% and a Zacks Rank #1 (Strong Buy), currently. You can see the complete list of today’s Zacks #1 Rank stocks here.
Ollie’s Bargain Outlet OLLI has a long-term earnings growth rate of 14.4% and a Zacks Rank #2 (Buy) at present.
Albertsons Companies ACI, presently a Zacks #2 Ranked stock, has a long-term earnings growth rate of 12%.
Want the latest recommendations from Zacks Investment Research? Today, you can download 7 Best Stocks for the Next 30 Days. Click to get this free report
Newell Brands Inc. (NWL) : Free Stock Analysis Report
Albertsons Companies, Inc. (ACI) : Free Stock Analysis Report
Ollies Bargain Outlet Holdings, Inc. (OLLI) : Free Stock Analysis Report
Chewy Inc. (CHWY) : Free Stock Analysis Report
To read this article on Zacks.com click here.
Zacks Investment Research
