
 Yahoo Finance
 Newell Brands Inc.'s (NASDAQ:NWL) Price Is Right But Growth Is Lacking
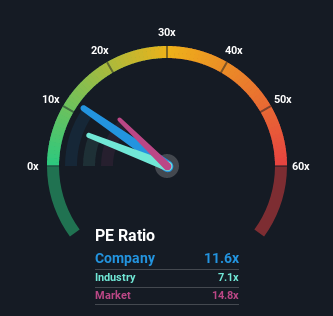
With a price-to-earnings (or "P/E") ratio of 11.6x Newell Brands Inc. (NASDAQ:NWL) may be sending bullish signals at the moment, given that almost half of all companies in the United States have P/E ratios greater than 15x and even P/E's higher than 30x are not unusual. Nonetheless, we'd need to dig a little deeper to determine if there is a rational basis for the reduced P/E.
Recent times haven't been advantageous for Newell Brands as its earnings have been rising slower than most other companies. The P/E is probably low because investors think this lacklustre earnings performance isn't going to get any better. If you still like the company, you'd be hoping earnings don't get any worse and that you could pick up some stock while it's out of favour.
See our latest analysis for Newell Brands
Keen to find out how analysts think Newell Brands' future stacks up against the industry? In that case, our free report is a great place to start.
Does Growth Match The Low P/E?
In order to justify its P/E ratio, Newell Brands would need to produce sluggish growth that's trailing the market.
Taking a look back first, we see that the company grew earnings per share by an impressive 20% last year. However, the latest three year period hasn't been as great in aggregate as it didn't manage to provide any growth at all. So it appears to us that the company has had a mixed result in terms of growing earnings over that time.
Turning to the outlook, the next three years should generate growth of 6.2% per annum as estimated by the ten analysts watching the company. With the market predicted to deliver 11% growth each year, the company is positioned for a weaker earnings result.
With this information, we can see why Newell Brands is trading at a P/E lower than the market. Apparently many shareholders weren't comfortable holding on while the company is potentially eyeing a less prosperous future.
The Bottom Line On Newell Brands' P/E
It's argued the price-to-earnings ratio is an inferior measure of value within certain industries, but it can be a powerful business sentiment indicator.
As we suspected, our examination of Newell Brands' analyst forecasts revealed that its inferior earnings outlook is contributing to its low P/E. Right now shareholders are accepting the low P/E as they concede future earnings probably won't provide any pleasant surprises. Unless these conditions improve, they will continue to form a barrier for the share price around these levels.
Before you take the next step, you should know about the 2 warning signs for Newell Brands (1 is potentially serious!) that we have uncovered.
If these risks are making you reconsider your opinion on Newell Brands, explore our interactive list of high quality stocks to get an idea of what else is out there.
Have feedback on this article? Concerned about the content? Get in touch with us directly. Alternatively, email editorial-team (at) simplywallst.com.
This article by Simply Wall St is general in nature. We provide commentary based on historical data and analyst forecasts only using an unbiased methodology and our articles are not intended to be financial advice. It does not constitute a recommendation to buy or sell any stock, and does not take account of your objectives, or your financial situation. We aim to bring you long-term focused analysis driven by fundamental data. Note that our analysis may not factor in the latest price-sensitive company announcements or qualitative material. Simply Wall St has no position in any stocks mentioned.
