
 Yahoo Finance
 What You Must Know About Evolution Mining Limited’s (ASX:EVN) Financial Health

Small-cap and large-cap companies receive a lot of attention from investors, but mid-cap stocks like Evolution Mining Limited (ASX:EVN), with a market cap of AU$5.84b, are often out of the spotlight. However, generally ignored mid-caps have historically delivered better risk adjusted returns than both of those groups. EVN’s financial liquidity and debt position will be analysed in this article, to get an idea of whether the company can fund opportunities for strategic growth and maintain strength through economic downturns. Note that this commentary is very high-level and solely focused on financial health, so I suggest you dig deeper yourself into EVN here. Check out our latest analysis for Evolution Mining
Does EVN produce enough cash relative to debt?
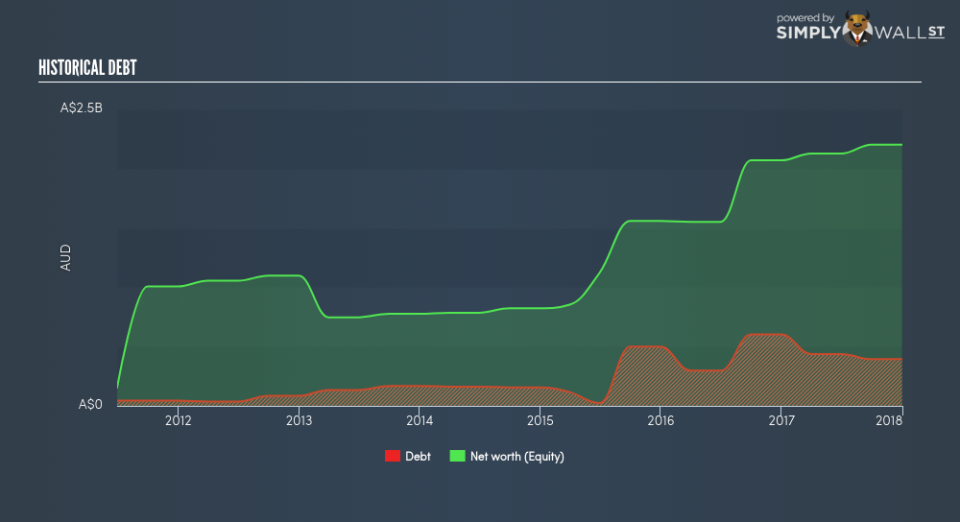
EVN’s debt levels surged from AU$296.46m to AU$436.12m over the last 12 months , which comprises of short- and long-term debt. With this rise in debt, EVN currently has AU$37.39m remaining in cash and short-term investments , ready to deploy into the business. Moreover, EVN has produced cash from operations of AU$650.80m in the last twelve months, resulting in an operating cash to total debt ratio of 149.22%, indicating that EVN’s operating cash is sufficient to cover its debt. This ratio can also be a sign of operational efficiency as an alternative to return on assets. In EVN’s case, it is able to generate 1.49x cash from its debt capital.
Can EVN pay its short-term liabilities?
With current liabilities at AU$279.62m, it appears that the company has been able to meet these obligations given the level of current assets of AU$377.37m, with a current ratio of 1.35x. Usually, for Metals and Mining companies, this is a suitable ratio since there is a bit of a cash buffer without leaving too much capital in a low-return environment.
Can EVN service its debt comfortably?
EVN’s level of debt is appropriate relative to its total equity, at 17.88%. EVN is not taking on too much debt commitment, which may be constraining for future growth. We can check to see whether EVN is able to meet its debt obligations by looking at the net interest coverage ratio. A company generating earnings before interest and tax (EBIT) at least three times its net interest payments is considered financially sound. In EVN’s, case, the ratio of 11.25x suggests that interest is comfortably covered, which means that debtors may be willing to loan the company more money, giving EVN ample headroom to grow its debt facilities.
Next Steps:
EVN has demonstrated its ability to generate sufficient levels of cash flow, while its debt hovers at a safe level. In addition to this, the company exhibits proper management of current assets and upcoming liabilities. I admit this is a fairly basic analysis for EVN’s financial health. Other important fundamentals need to be considered alongside. I recommend you continue to research Evolution Mining to get a more holistic view of the stock by looking at:
Future Outlook: What are well-informed industry analysts predicting for EVN’s future growth? Take a look at our free research report of analyst consensus for EVN’s outlook.
Valuation: What is EVN worth today? Is the stock undervalued, even when its growth outlook is factored into its intrinsic value? The intrinsic value infographic in our free research report helps visualize whether EVN is currently mispriced by the market.
Other High-Performing Stocks: Are there other stocks that provide better prospects with proven track records? Explore our free list of these great stocks here.
To help readers see pass the short term volatility of the financial market, we aim to bring you a long-term focused research analysis purely driven by fundamental data. Note that our analysis does not factor in the latest price sensitive company announcements.
The author is an independent contributor and at the time of publication had no position in the stocks mentioned.
