
 Yahoo Finance
 What You Must Know About Diamondback Energy, Inc.'s (NASDAQ:FANG) Financial Health

With a market capitalization of US$17b, Diamondback Energy, Inc. (NASDAQ:FANG) is a large-cap stock, which is considered by most investors as a safe bet. Common characteristics for these big stocks are their strong balance sheet and high liquidity, which means there's plenty of stocks available to the public for trading. These companies are resilient in times of low liquidity and are not as strongly impacted by interest rate hikes as companies with lots of debt. Using the most recent data for FANG, I will determine its financial status based on its solvency and liquidity, and assess whether the stock is a safe investment.
View our latest analysis for Diamondback Energy
Does FANG Produce Much Cash Relative To Its Debt?
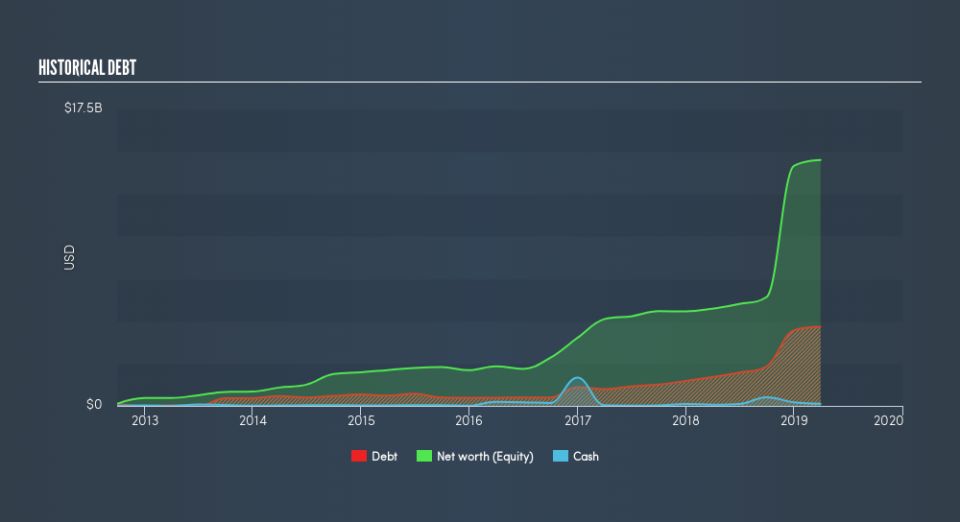
FANG has built up its total debt levels in the last twelve months, from US$1.7b to US$4.7b , which includes long-term debt. With this increase in debt, the current cash and short-term investment levels stands at US$126m , ready to be used for running the business. Additionally, FANG has generated cash from operations of US$1.6b over the same time period, resulting in an operating cash to total debt ratio of 34%, meaning that FANG’s current level of operating cash is high enough to cover debt.
Can FANG pay its short-term liabilities?
Looking at FANG’s US$1.1b in current liabilities, it appears that the company may not be able to easily meet these obligations given the level of current assets of US$693m, with a current ratio of 0.62x. The current ratio is the number you get when you divide current assets by current liabilities.
Can FANG service its debt comfortably?
With a debt-to-equity ratio of 32%, FANG's debt level may be seen as prudent. This range is considered safe as FANG is not taking on too much debt obligation, which can be restrictive and risky for equity-holders. We can check to see whether FANG is able to meet its debt obligations by looking at the net interest coverage ratio. A company generating earnings after interest and tax at least three times its net interest payments is considered financially sound. For FANG, the ratio of 8.09x suggests that interest is well-covered. It is considered a responsible and reassuring practice to maintain high interest coverage, which makes FANG and other large-cap investments thought to be safe.
Next Steps:
FANG has demonstrated its ability to generate sufficient levels of cash flow, while its debt hovers at an appropriate level. However, its lack of liquidity raises questions over current asset management practices for the large-cap. This is only a rough assessment of financial health, and I'm sure FANG has company-specific issues impacting its capital structure decisions. I recommend you continue to research Diamondback Energy to get a better picture of the stock by looking at:
Future Outlook: What are well-informed industry analysts predicting for FANG’s future growth? Take a look at our free research report of analyst consensus for FANG’s outlook.
Valuation: What is FANG worth today? Is the stock undervalued, even when its growth outlook is factored into its intrinsic value? The intrinsic value infographic in our free research report helps visualize whether FANG is currently mispriced by the market.
Other High-Performing Stocks: Are there other stocks that provide better prospects with proven track records? Explore our free list of these great stocks here.
We aim to bring you long-term focused research analysis driven by fundamental data. Note that our analysis may not factor in the latest price-sensitive company announcements or qualitative material.
If you spot an error that warrants correction, please contact the editor at editorial-team@simplywallst.com. This article by Simply Wall St is general in nature. It does not constitute a recommendation to buy or sell any stock, and does not take account of your objectives, or your financial situation. Simply Wall St has no position in the stocks mentioned. Thank you for reading.
