
 Yahoo Finance
 MSC Industrial Direct Co Inc's Dividend Analysis
An In-Depth Look at MSC Industrial Direct Co Inc's Upcoming Dividend and Financial Health
MSC Industrial Direct Co Inc(NYSE:MSM) recently announced a dividend of $0.83 per share, payable on 2024-04-23, with the ex-dividend date set for 2024-04-08. As investors look forward to this upcoming payment, the spotlight also shines on the company's dividend history, yield, and growth rates. Using the data from GuruFocus, let's look into MSC Industrial Direct Co Inc's dividend performance and assess its sustainability.
What Does MSC Industrial Direct Co Inc Do?
This Powerful Chart Made Peter Lynch 29% A Year For 13 Years
How to calculate the intrinsic value of a stock?
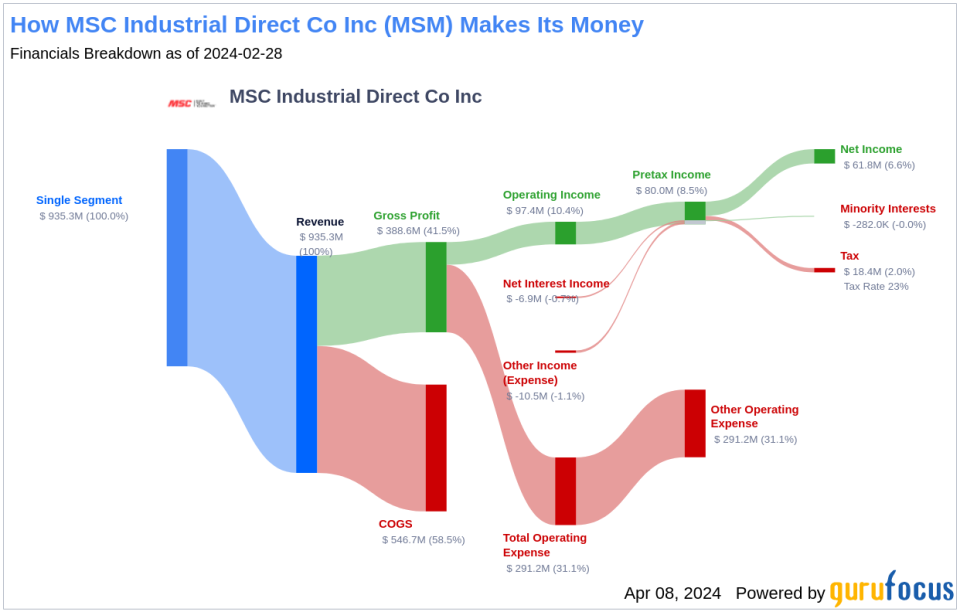
MSC Industrial Direct is one of the largest industrial distributors with a focus on metalworking and maintenance, repair, and operations products and services. The company offers over 2 million products through its distribution network, which has 11 fulfillment centers. Although MSC has a presence in Canada, Mexico, and the United Kingdom, it primarily operates in the United States. In fiscal 2023, 95% of the firm's $4.0 billion of sales was generated in the U.S.
A Glimpse at MSC Industrial Direct Co Inc's Dividend History
MSC Industrial Direct Co Inc has maintained a consistent dividend payment record since 2003. Dividends are currently distributed on a quarterly basis. MSC Industrial Direct Co Inc has increased its dividend each year since 2003. The stock is thus listed as a dividend achiever, an honor that is given to companies that have increased their dividend each year for at least the past 21 years. Below is a chart showing annual Dividends Per Share for tracking historical trends.
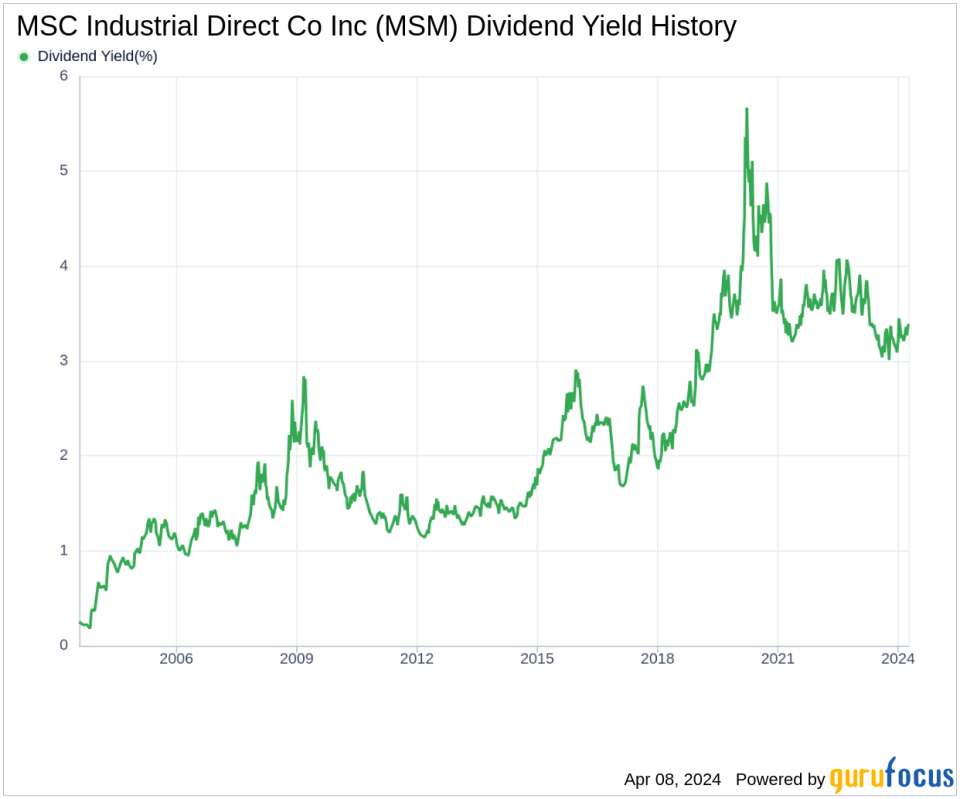
Breaking Down MSC Industrial Direct Co Inc's Dividend Yield and Growth
As of today, MSC Industrial Direct Co Inc currently has a 12-month trailing dividend yield of 3.39% and a 12-month forward dividend yield of 3.47%. This suggests an expectation of increased dividend payments over the next 12 months.
Over the past three years, MSC Industrial Direct Co Inc's annual dividend growth rate was 1.70%. Extended to a five-year horizon, this rate increased to 6.30% per year. And over the past decade, MSC Industrial Direct Co Inc's annual dividends per share growth rate stands at an impressive 11.00%.
Based on MSC Industrial Direct Co Inc's dividend yield and five-year growth rate, the 5-year yield on cost of MSC Industrial Direct Co Inc stock as of today is approximately 4.60%.
The Sustainability Question: Payout Ratio and Profitability
To assess the sustainability of the dividend, one needs to evaluate the company's payout ratio. The dividend payout ratio provides insights into the portion of earnings the company distributes as dividends. A lower ratio suggests that the company retains a significant part of its earnings, thereby ensuring the availability of funds for future growth and unexpected downturns. As of 2024-02-29, MSC Industrial Direct Co Inc's dividend payout ratio is 0.56.
MSC Industrial Direct Co Inc's profitability rank, offers an understanding of the company's earnings prowess relative to its peers. GuruFocus ranks MSC Industrial Direct Co Inc's profitability 8 out of 10 as of 2024-02-29, suggesting good profitability prospects. The company has reported positive net income for each of year over the past decade, further solidifying its high profitability.
Growth Metrics: The Future Outlook
To ensure the sustainability of dividends, a company must have robust growth metrics. MSC Industrial Direct Co Inc's growth rank of 8 out of 10 suggests that the company's growth trajectory is good relative to its competitors.
Revenue is the lifeblood of any company, and MSC Industrial Direct Co Inc's revenue per share, combined with the 3-year revenue growth rate, indicates a strong revenue model. MSC Industrial Direct Co Inc's revenue has increased by approximately 7.50% per year on average, a rate that underperforms than approximately 54.61% of global competitors.
The company's 3-year EPS growth rate showcases its capability to grow its earnings, a critical component for sustaining dividends in the long run. During the past three years, MSC Industrial Direct Co Inc's earnings increased by approximately 9.50% per year on average, a rate that underperforms than approximately 68.1% of global competitors.
Lastly, the company's 5-year EBITDA growth rate of 2.10%, which underperforms than approximately 79.07% of global competitors.
Concluding Thoughts on MSC Industrial Direct Co Inc's Dividend Profile
MSC Industrial Direct Co Inc's dividend payments, dividend growth rate, payout ratio, profitability, and growth metrics paint a picture of a company committed to returning value to shareholders through consistent dividends. The company's long history of dividend growth and its strategic positioning in the industrial sector suggest a reliable investment for those seeking dividend income. However, investors should also consider the growth challenges in comparison to global competitors. As they weigh these factors, value investors may find MSC Industrial Direct Co Inc an attractive component in a diversified income-generating portfolio.
GuruFocus Premium users can screen for high-dividend yield stocks using the High Dividend Yield Screener.
This article, generated by GuruFocus, is designed to provide general insights and is not tailored financial advice. Our commentary is rooted in historical data and analyst projections, utilizing an impartial methodology, and is not intended to serve as specific investment guidance. It does not formulate a recommendation to purchase or divest any stock and does not consider individual investment objectives or financial circumstances. Our objective is to deliver long-term, fundamental data-driven analysis. Be aware that our analysis might not incorporate the most recent, price-sensitive company announcements or qualitative information. GuruFocus holds no position in the stocks mentioned herein.
This article first appeared on GuruFocus.
