
 Yahoo Finance
 Monadelphous Group Limited (ASX:MND) Earns A Nice Return On Capital Employed

Today we'll evaluate Monadelphous Group Limited (ASX:MND) to determine whether it could have potential as an investment idea. Specifically, we're going to calculate its Return On Capital Employed (ROCE), in the hopes of getting some insight into the business.
First, we'll go over how we calculate ROCE. Next, we'll compare it to others in its industry. Finally, we'll look at how its current liabilities affect its ROCE.
Return On Capital Employed (ROCE): What is it?
ROCE is a measure of a company's yearly pre-tax profit (its return), relative to the capital employed in the business. Generally speaking a higher ROCE is better. Overall, it is a valuable metric that has its flaws. Renowned investment researcher Michael Mauboussin has suggested that a high ROCE can indicate that 'one dollar invested in the company generates value of more than one dollar'.
How Do You Calculate Return On Capital Employed?
Analysts use this formula to calculate return on capital employed:
Return on Capital Employed = Earnings Before Interest and Tax (EBIT) ÷ (Total Assets - Current Liabilities)
Or for Monadelphous Group:
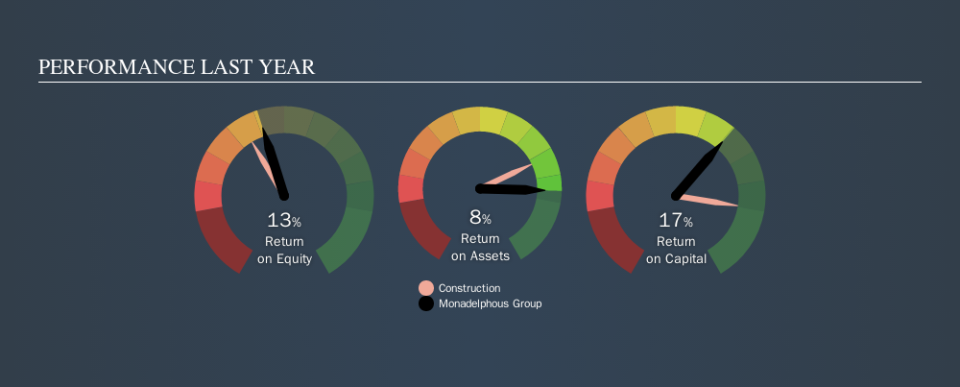
0.17 = AU$72m ÷ (AU$685m - AU$258m) (Based on the trailing twelve months to June 2019.)
So, Monadelphous Group has an ROCE of 17%.
Check out our latest analysis for Monadelphous Group
Is Monadelphous Group's ROCE Good?
ROCE can be useful when making comparisons, such as between similar companies. In our analysis, Monadelphous Group's ROCE is meaningfully higher than the 11% average in the Construction industry. We would consider this a positive, as it suggests it is using capital more effectively than other similar companies. Separate from Monadelphous Group's performance relative to its industry, its ROCE in absolute terms looks satisfactory, and it may be worth researching in more depth.
Monadelphous Group's current ROCE of 17% is lower than its ROCE in the past, which was 24%, 3 years ago. So investors might consider if it has had issues recently. You can click on the image below to see (in greater detail) how Monadelphous Group's past growth compares to other companies.
It is important to remember that ROCE shows past performance, and is not necessarily predictive. ROCE can be deceptive for cyclical businesses, as returns can look incredible in boom times, and terribly low in downturns. ROCE is only a point-in-time measure. What happens in the future is pretty important for investors, so we have prepared a free report on analyst forecasts for Monadelphous Group.
Monadelphous Group's Current Liabilities And Their Impact On Its ROCE
Short term (or current) liabilities, are things like supplier invoices, overdrafts, or tax bills that need to be paid within 12 months. The ROCE equation subtracts current liabilities from capital employed, so a company with a lot of current liabilities appears to have less capital employed, and a higher ROCE than otherwise. To counter this, investors can check if a company has high current liabilities relative to total assets.
Monadelphous Group has total liabilities of AU$258m and total assets of AU$685m. As a result, its current liabilities are equal to approximately 38% of its total assets. Monadelphous Group has a medium level of current liabilities, which would boost the ROCE.
What We Can Learn From Monadelphous Group's ROCE
While its ROCE looks good, it's worth remembering that the current liabilities are making the business look better. Monadelphous Group shapes up well under this analysis, but it is far from the only business delivering excellent numbers . You might also want to check this free collection of companies delivering excellent earnings growth.
If you are like me, then you will not want to miss this free list of growing companies that insiders are buying.
We aim to bring you long-term focused research analysis driven by fundamental data. Note that our analysis may not factor in the latest price-sensitive company announcements or qualitative material.
If you spot an error that warrants correction, please contact the editor at editorial-team@simplywallst.com. This article by Simply Wall St is general in nature. It does not constitute a recommendation to buy or sell any stock, and does not take account of your objectives, or your financial situation. Simply Wall St has no position in the stocks mentioned. Thank you for reading.
