
 Yahoo Finance
 Molson Coors (TAP) Stock Rises as Q4 Earnings Beat Estimates
Molson Coors Beverage Company TAP reported mixed fourth-quarter 2019 results, wherein the top line missed estimates but the bottom line beat the same. However, adjusted earnings and sales increased on a year-over-year basis. This marked the second straight earnings beat and the fifth consecutive negative sales surprise.
Shares of Molson Coors grew nearly 5% in the pre-market trading session. Moreover, the Zacks Rank #3 (Hold) company’s shares have gained 11.8% in the past three months against the industry’s decline of 7.6%.

Delving Deeper
Molson Coors’ underlying adjusted earnings of $1.02 per share improved 21.4% year over year and beat the Zacks Consensus Estimate of 76 cents. The bottom line benefited from positive global net pricing, cost savings, a non-recurring gain from the resolution of a vendor dispute in the United States, lower marketing, general and administrative expenses, and timing of marketing investments.
Molson Coors Brewing Company Price, Consensus and EPS Surprise
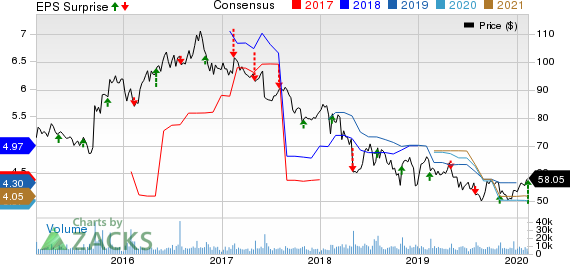
Molson Coors Brewing Company price-consensus-eps-surprise-chart | Molson Coors Brewing Company Quote
The aforementioned factors also led to an increase in the company’s underlying EBITDA, which moved up 15.5% to $563.1 million year over year. Further, underlying EBITDA increased 15.8% year over year in constant currency.
Net sales rose 2.8% to $2,486.2 million but missed the Zacks Consensus Estimate of $2,506 million. The year-over-year improvement was driven by rise in net sales per hectoliter and higher financial volume. On a constant-currency basis, net sales increased 3%.
Notably, net sales per hectoliter improved 1.8% on a reported financial-volume basis. Moreover, net sales per hectoliter on a brand volume basis increased 1.1% in constant currency, owing to favorable pricing and global mix due to the company’s focus on portfolio premiumization.
However, Molson Coors’ worldwide brand volume declined 1% to 21.8 million hectoliters and financial volume moved up 1% to 21.8 million hectoliters. The decline in worldwide brand volume was mainly attributed to lower economy volumes in the United States and soft performance in Canada, partly compensated by strength in International. Meanwhile, financial volume was hurt by the quarterly timing of distributor inventory levels in the United States and growth in International, partly negated by volume declines in Canada and Europe. Nevertheless, global priority brand volume was up 1.6%.
Segmental Details
The company operates through the following geographical segments.
Canada: Molson Coors’ Canada net sales declined 4.6% to $307.1 million on a reported basis and 4.8% in constant currency, driven by a decline in volume and 0.7% fall in net sales per hectoliter (brand volume basis), in constant currency, driven by higher unfavorable mix. Canada brand volume fell 6.9% and financial volume decreased 4%, owing to soft brand performance and industry declines. However, financial volume partly benefited from cycling lower customer inventory levels in the prior year. Underlying EBITDA was flat with last year at $64.7 million, with a constant-currency decline of 0.9%.
United States: Molson Coors now has complete ownership rights to all the brands in the MillerCoors portfolio for the U.S. market. Net sales for the segment increased 4.7% to $1,679.9 million on reported and constant-currency basis mainly due to higher financial volume and 1.6% growth in net sales per hectoliter (brand volume basis), driven by higher net pricing.
However, U.S. brand volume declined 1.7%, owing to declines in the economy segment, offset by rise in the premium light and above premium portfolio trends. Sales-to-wholesalers (STWs) volume, excluding contract brewing, grew 2.5% on cycling lower shipments in the prior year, owing to quarterly timing of distributor inventories, partially negated by lower brand volume. The segment’s underlying EBITDA rose 16.5% year over year to $431.3 million, with constant-currency growth of 16.6%.
Europe: The segment’s reported net sales grew 1.1% to $469.3 million and improved 2.1% in constant currency. Net sales in constant currency benefited from a 4% increase in net sales per hectoliter (brand volume basis) in constant currency due to positive pricing and favorable sales mix, offset by lower brand volume. Europe brand and financial volume declined 0.4% and 1.4%, respectively. The decline in brand volume was attributed to lower brand performance, offset by strong momentum in the premium portfolio in the fourth quarter, which resulted in higher volume growth than the year. Underlying EBITDA increased 15.4% year over year to $93.1 million and 18% in constant currency.
International: Net sales for the segment were up 7.5% on both reported and constant currency basis. Reported net sales were $62 million. Robust sales were driven by brand volume growth, offset by 5.3% fall in net sales per hectoliter (brand volume basis) in constant currency, on unfavorable geographic mix. International brand volume increased 13.9% on strong Coors Light performance in Mexico, sustained growth in Argentina and the timing of STWs. This was partly offset by India supply chain and soft demand. The segment’s underlying EBITDA was $4.1 million, reflecting year-over-year improvements of 46.4% on a reported basis and 50% on a constant currency basis.
Other Financial Updates
Molson Coors ended the year with cash and cash equivalents of $523.4 million, and total debt of $9,038 million. This resulted in net debt of $8,514 million at the end of 2019.
The company generated net cash provided in operating activities of $1,897.3 million in 2019, with underlying free cash flow of $1,369.8 million.
Cost-Saving Update
During 2019, Molson Coors delivered cost savings of nearly $230 million, resulting in a total savings of $725 million under the 2017-2019 program. The three-year savings were ahead of the company’s latest guidance of $700 million and initial guidance of $550 million. As part of the savings program, it incurred total one-time costs of $31 million in 2019 and nearly $208 million for the 2017-2019 period.
Going forward, the company remains committed to delivering more cost savings under its next-generation cost-saving program, which began in 2020. It expects the current program to generate cost savings of $600 million over the three years ending 2022. These cost savings include $150 million related to the revitalization plan.
Further, it expects to incur one-time costs of $120-$180 million for generating savings from the revitalization plan.
Outlook
Management reiterated its initial sales view for 2020. However, it revised underlying EBITDA guidance for 2020.
For 2020, the company expects flat to low-single-digit decline in net sales on a constant currency basis. Underlying EBITDA is expected to decline in high-single digits year over year in constant currency. Earlier, the company had anticipated a mid-single-digit decline in underlying EBITDA in constant currency. Further, it expects to generate underlying free cash flow of $1.1 billion (plus or minus 10%).
Capital spending is expected to be roughly $700 million (plus or minus 10%). Underlying tax rate for 2020 and beyond is likely to be 20-24%. Additionally, net interest expenses are projected to be $280 million (plus or minus 5%).
Don’t Miss These Better-Ranked Beverage Stocks
Constellation Brands Inc. STZ, with long-term earnings per share growth rate of 8.2%, currently carries a Zacks Rank #2 (Buy). You can see the complete list of today’s Zacks #1 Rank (Strong Buy) stocks here.
The Coca-Cola Company KO has long-term earnings per share growth rate of 7.2%. The company carries a Zacks Rank #2 at present.
Monster Beverage Corporation MNST, also a Zacks Rank #2 stock, has long-term earnings per share growth rate of 13.5%.
Today's Best Stocks from Zacks
Would you like to see the updated picks from our best market-beating strategies? From 2017 through 2019, while the S&P 500 gained and impressive +53.6%, five of our strategies returned +65.8%, +97.1%, +118.0%, +175.7% and even +186.7%.
This outperformance has not just been a recent phenomenon. From 2000 – 2019, while the S&P averaged +6.0% per year, our top strategies averaged up to +54.7% per year.
See their latest picks free >>
Want the latest recommendations from Zacks Investment Research? Today, you can download 7 Best Stocks for the Next 30 Days. Click to get this free report
Molson Coors Brewing Company (TAP) : Free Stock Analysis Report
Constellation Brands Inc (STZ) : Free Stock Analysis Report
Coca-Cola Company (The) (KO) : Free Stock Analysis Report
Monster Beverage Corporation (MNST) : Free Stock Analysis Report
To read this article on Zacks.com click here.
Zacks Investment Research
