
 Yahoo Finance
 MMA Offshore (ASX:MRM) shareholders have earned a 138% return over the last year
Unfortunately, investing is risky - companies can and do go bankrupt. But if you pick the right business to buy shares in, you can make more than you can lose. For example, the MMA Offshore Limited (ASX:MRM) share price has soared 138% in the last 1 year. Most would be very happy with that, especially in just one year! Also pleasing for shareholders was the 34% gain in the last three months. In contrast, the longer term returns are negative, since the share price is 44% lower than it was three years ago.
So let's assess the underlying fundamentals over the last 1 year and see if they've moved in lock-step with shareholder returns.
Check out our latest analysis for MMA Offshore
While the efficient markets hypothesis continues to be taught by some, it has been proven that markets are over-reactive dynamic systems, and investors are not always rational. One imperfect but simple way to consider how the market perception of a company has shifted is to compare the change in the earnings per share (EPS) with the share price movement.
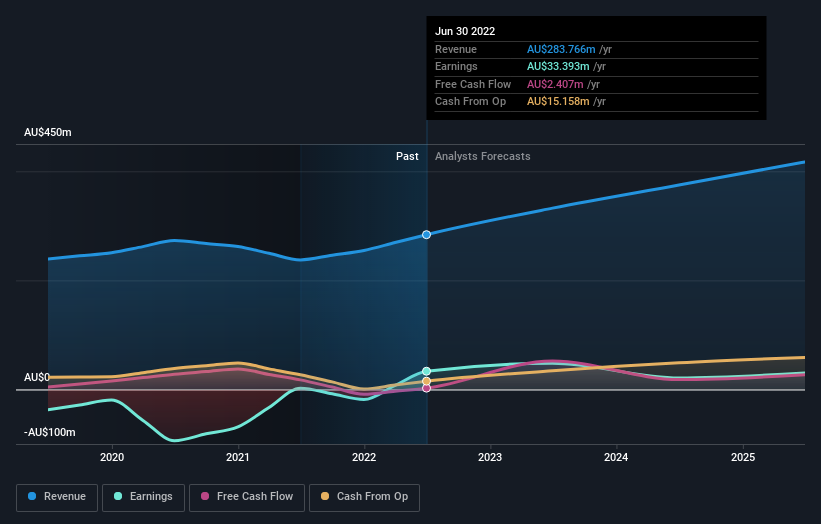
During the last year MMA Offshore grew its earnings per share, moving from a loss to a profit.
When a company is just on the edge of profitability it can be well worth considering other metrics in order to more precisely gauge growth (and therefore understand share price movements).
However the year on year revenue growth of 19% would help. We do see some companies suppress earnings in order to accelerate revenue growth.
The graphic below depicts how earnings and revenue have changed over time (unveil the exact values by clicking on the image).
We know that MMA Offshore has improved its bottom line over the last three years, but what does the future have in store? It might be well worthwhile taking a look at our free report on how its financial position has changed over time.
A Different Perspective
It's good to see that MMA Offshore has rewarded shareholders with a total shareholder return of 138% in the last twelve months. Notably the five-year annualised TSR loss of 8% per year compares very unfavourably with the recent share price performance. We generally put more weight on the long term performance over the short term, but the recent improvement could hint at a (positive) inflection point within the business. While it is well worth considering the different impacts that market conditions can have on the share price, there are other factors that are even more important. To that end, you should learn about the 3 warning signs we've spotted with MMA Offshore (including 1 which makes us a bit uncomfortable) .
For those who like to find winning investments this free list of growing companies with recent insider purchasing, could be just the ticket.
Please note, the market returns quoted in this article reflect the market weighted average returns of stocks that currently trade on AU exchanges.
Have feedback on this article? Concerned about the content? Get in touch with us directly. Alternatively, email editorial-team (at) simplywallst.com.
This article by Simply Wall St is general in nature. We provide commentary based on historical data and analyst forecasts only using an unbiased methodology and our articles are not intended to be financial advice. It does not constitute a recommendation to buy or sell any stock, and does not take account of your objectives, or your financial situation. We aim to bring you long-term focused analysis driven by fundamental data. Note that our analysis may not factor in the latest price-sensitive company announcements or qualitative material. Simply Wall St has no position in any stocks mentioned.
Join A Paid User Research Session
You’ll receive a US$30 Amazon Gift card for 1 hour of your time while helping us build better investing tools for the individual investors like yourself. Sign up here
