
 Yahoo Finance
 Can Mixed Fundamentals Have A Negative Impact on Trajan Group Holdings Limited (ASX:TRJ) Current Share Price Momentum?
Trajan Group Holdings (ASX:TRJ) has had a great run on the share market with its stock up by a significant 30% over the last three months. But the company's key financial indicators appear to be differing across the board and that makes us question whether or not the company's current share price momentum can be maintained. In this article, we decided to focus on Trajan Group Holdings' ROE.
ROE or return on equity is a useful tool to assess how effectively a company can generate returns on the investment it received from its shareholders. In short, ROE shows the profit each dollar generates with respect to its shareholder investments.
View our latest analysis for Trajan Group Holdings
How Do You Calculate Return On Equity?
ROE can be calculated by using the formula:
Return on Equity = Net Profit (from continuing operations) ÷ Shareholders' Equity
So, based on the above formula, the ROE for Trajan Group Holdings is:
3.7% = AU$4.7m ÷ AU$127m (Based on the trailing twelve months to December 2022).
The 'return' refers to a company's earnings over the last year. One way to conceptualize this is that for each A$1 of shareholders' capital it has, the company made A$0.04 in profit.
What Has ROE Got To Do With Earnings Growth?
We have already established that ROE serves as an efficient profit-generating gauge for a company's future earnings. Based on how much of its profits the company chooses to reinvest or "retain", we are then able to evaluate a company's future ability to generate profits. Generally speaking, other things being equal, firms with a high return on equity and profit retention, have a higher growth rate than firms that don’t share these attributes.
A Side By Side comparison of Trajan Group Holdings' Earnings Growth And 3.7% ROE
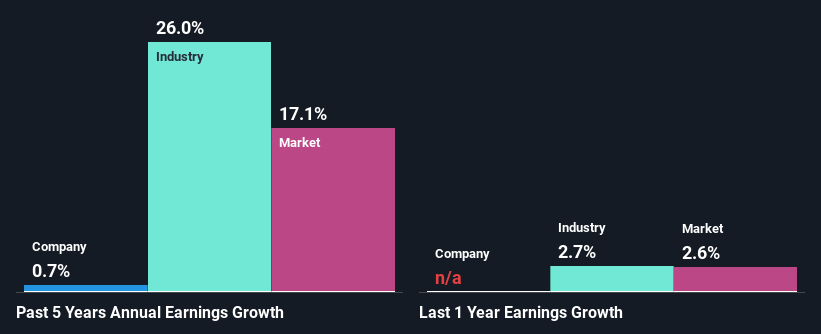
It is hard to argue that Trajan Group Holdings' ROE is much good in and of itself. Even compared to the average industry ROE of 9.9%, the company's ROE is quite dismal. Hence, the flat earnings seen by Trajan Group Holdings over the past five years could probably be the result of it having a lower ROE.
Next, on comparing with the industry net income growth, we found that Trajan Group Holdings' reported growth was lower than the industry growth of 26% over the last few years, which is not something we like to see.
Earnings growth is an important metric to consider when valuing a stock. The investor should try to establish if the expected growth or decline in earnings, whichever the case may be, is priced in. Doing so will help them establish if the stock's future looks promising or ominous. Has the market priced in the future outlook for TRJ? You can find out in our latest intrinsic value infographic research report.
Is Trajan Group Holdings Making Efficient Use Of Its Profits?
Trajan Group Holdings doesn't pay any dividend, meaning that the company is keeping all of its profits, which makes us wonder why it is retaining its earnings if it can't use them to grow its business. So there might be other factors at play here which could potentially be hampering growth. For example, the business has faced some headwinds.
Conclusion
In total, we're a bit ambivalent about Trajan Group Holdings' performance. While the company does have a high rate of profit retention, its low rate of return is probably hampering its earnings growth. With that said, the latest industry analyst forecasts reveal that the company's earnings are expected to accelerate. To know more about the company's future earnings growth forecasts take a look at this free report on analyst forecasts for the company to find out more.
Have feedback on this article? Concerned about the content? Get in touch with us directly. Alternatively, email editorial-team (at) simplywallst.com.
This article by Simply Wall St is general in nature. We provide commentary based on historical data and analyst forecasts only using an unbiased methodology and our articles are not intended to be financial advice. It does not constitute a recommendation to buy or sell any stock, and does not take account of your objectives, or your financial situation. We aim to bring you long-term focused analysis driven by fundamental data. Note that our analysis may not factor in the latest price-sensitive company announcements or qualitative material. Simply Wall St has no position in any stocks mentioned.
