
 Yahoo Finance
 Millicom International Cellular S.A. (NASDAQ:TIGO) Not Lagging Market On Growth Or Pricing
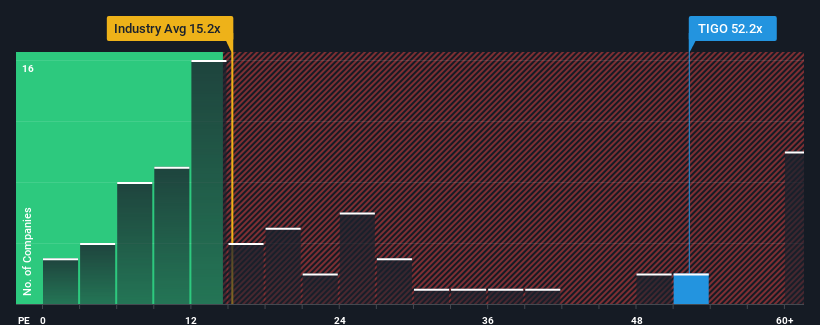
When close to half the companies in the United States have price-to-earnings ratios (or "P/E's") below 14x, you may consider Millicom International Cellular S.A. (NASDAQ:TIGO) as a stock to avoid entirely with its 52.2x P/E ratio. Although, it's not wise to just take the P/E at face value as there may be an explanation why it's so lofty.
Millicom International Cellular hasn't been tracking well recently as its declining earnings compare poorly to other companies, which have seen some growth on average. It might be that many expect the dour earnings performance to recover substantially, which has kept the P/E from collapsing. You'd really hope so, otherwise you're paying a pretty hefty price for no particular reason.
Check out our latest analysis for Millicom International Cellular
Want the full picture on analyst estimates for the company? Then our free report on Millicom International Cellular will help you uncover what's on the horizon.
What Are Growth Metrics Telling Us About The High P/E?
In order to justify its P/E ratio, Millicom International Cellular would need to produce outstanding growth well in excess of the market.
Retrospectively, the last year delivered a frustrating 92% decrease to the company's bottom line. This means it has also seen a slide in earnings over the longer-term as EPS is down 59% in total over the last three years. Therefore, it's fair to say the earnings growth recently has been undesirable for the company.
Shifting to the future, estimates from the nine analysts covering the company suggest earnings should grow by 71% per annum over the next three years. That's shaping up to be materially higher than the 9.8% per year growth forecast for the broader market.
With this information, we can see why Millicom International Cellular is trading at such a high P/E compared to the market. It seems most investors are expecting this strong future growth and are willing to pay more for the stock.
The Key Takeaway
Typically, we'd caution against reading too much into price-to-earnings ratios when settling on investment decisions, though it can reveal plenty about what other market participants think about the company.
As we suspected, our examination of Millicom International Cellular's analyst forecasts revealed that its superior earnings outlook is contributing to its high P/E. At this stage investors feel the potential for a deterioration in earnings isn't great enough to justify a lower P/E ratio. It's hard to see the share price falling strongly in the near future under these circumstances.
Having said that, be aware Millicom International Cellular is showing 3 warning signs in our investment analysis, and 2 of those can't be ignored.
It's important to make sure you look for a great company, not just the first idea you come across. So take a peek at this free list of interesting companies with strong recent earnings growth (and a low P/E).
Have feedback on this article? Concerned about the content? Get in touch with us directly. Alternatively, email editorial-team (at) simplywallst.com.
This article by Simply Wall St is general in nature. We provide commentary based on historical data and analyst forecasts only using an unbiased methodology and our articles are not intended to be financial advice. It does not constitute a recommendation to buy or sell any stock, and does not take account of your objectives, or your financial situation. We aim to bring you long-term focused analysis driven by fundamental data. Note that our analysis may not factor in the latest price-sensitive company announcements or qualitative material. Simply Wall St has no position in any stocks mentioned.
Join A Paid User Research Session
You’ll receive a US$30 Amazon Gift card for 1 hour of your time while helping us build better investing tools for the individual investors like yourself. Sign up here
