
 Yahoo Finance
 You Might Like Orora Limited (ASX:ORA) But Do You Like Its Debt?

Orora Limited (ASX:ORA) is a small-cap stock with a market capitalization of AU$3.6b. While investors primarily focus on the growth potential and competitive landscape of the small-cap companies, they end up ignoring a key aspect, which could be the biggest threat to its existence: its financial health. Why is it important? Understanding the company's financial health becomes vital, as mismanagement of capital can lead to bankruptcies, which occur at a higher rate for small-caps. Let's work through some financial health checks you may wish to consider if you're interested in this stock. Nevertheless, this is not a comprehensive overview, so I suggest you dig deeper yourself into ORA here.
ORA’s Debt (And Cash Flows)
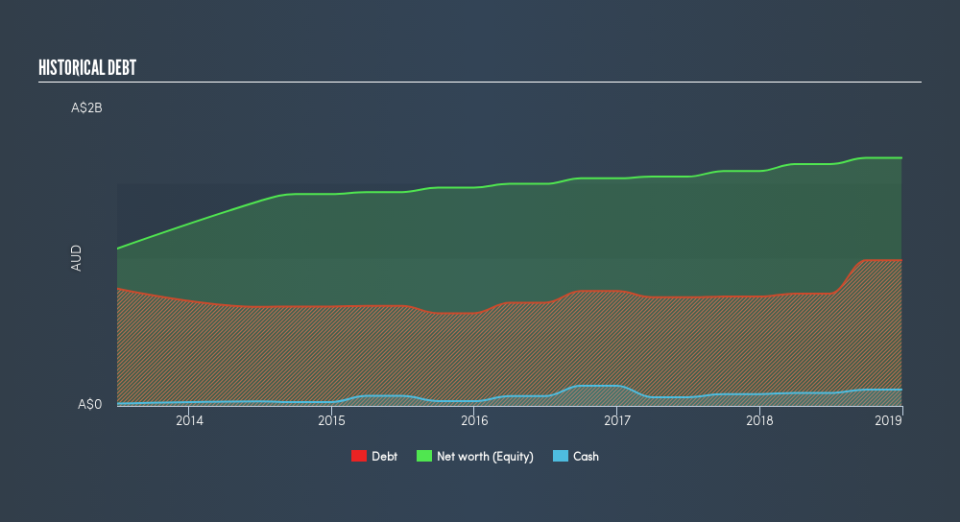
ORA has built up its total debt levels in the last twelve months, from AU$737m to AU$983m – this includes long-term debt. With this rise in debt, the current cash and short-term investment levels stands at AU$111m , ready to be used for running the business. Moreover, ORA has generated AU$316m in operating cash flow during the same period of time, leading to an operating cash to total debt ratio of 32%, indicating that ORA’s current level of operating cash is high enough to cover debt.
Does ORA’s liquid assets cover its short-term commitments?
Looking at ORA’s AU$1.5b in current liabilities, it seems that the business has maintained a safe level of current assets to meet its obligations, with the current ratio last standing at 1.05x. The current ratio is the number you get when you divide current assets by current liabilities. Generally, for Packaging companies, this is a reasonable ratio since there is a bit of a cash buffer without leaving too much capital in a low-return environment.
Can ORA service its debt comfortably?
With a debt-to-equity ratio of 59%, ORA can be considered as an above-average leveraged company. This is a bit unusual for a small-cap stock, since they generally have a harder time borrowing than large more established companies. We can test if ORA’s debt levels are sustainable by measuring interest payments against earnings of a company. Ideally, earnings before interest and tax (EBIT) should cover net interest by at least three times. For ORA, the ratio of 9.65x suggests that interest is appropriately covered, which means that lenders may be willing to lend out more funding as ORA’s high interest coverage is seen as responsible and safe practice.
Next Steps:
ORA’s high cash coverage means that, although its debt levels are high, the company is able to utilise its borrowings efficiently in order to generate cash flow. This may mean this is an optimal capital structure for the business, given that it is also meeting its short-term commitment. This is only a rough assessment of financial health, and I'm sure ORA has company-specific issues impacting its capital structure decisions. You should continue to research Orora to get a better picture of the small-cap by looking at:
Future Outlook: What are well-informed industry analysts predicting for ORA’s future growth? Take a look at our free research report of analyst consensus for ORA’s outlook.
Valuation: What is ORA worth today? Is the stock undervalued, even when its growth outlook is factored into its intrinsic value? The intrinsic value infographic in our free research report helps visualize whether ORA is currently mispriced by the market.
Other High-Performing Stocks: Are there other stocks that provide better prospects with proven track records? Explore our free list of these great stocks here.
We aim to bring you long-term focused research analysis driven by fundamental data. Note that our analysis may not factor in the latest price-sensitive company announcements or qualitative material.
If you spot an error that warrants correction, please contact the editor at editorial-team@simplywallst.com. This article by Simply Wall St is general in nature. It does not constitute a recommendation to buy or sell any stock, and does not take account of your objectives, or your financial situation. Simply Wall St has no position in the stocks mentioned. Thank you for reading.
