
 Yahoo Finance
 Mesut Ozil excited about ‘dream come true’ Fenerbahce transfer from Arsenal
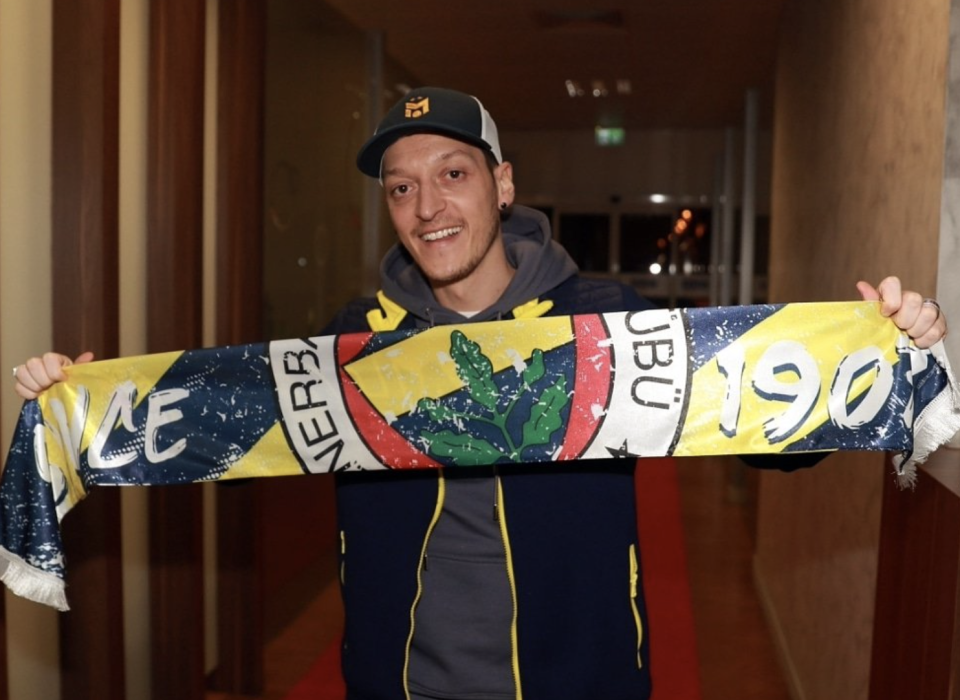
Mesut Ozil
(Mesut Ozil / Twitter)Mesut Ozil is closing in on his move to Turkish Super Lig side Fenerbahce, having arrived in Istanbul to finalise talks.
The Arsenal attacking midfielder has been left out of both Premier League and Europa League squads this season and manager Mikel Arteta has made it clear there is no place for the former Germany international in his plans for the future.
That remains the case despite the Gunners reverting to a 4-2-3-1 system of late, with Emile Smith Rowe operating in the No. 10 role which Ozil would otherwise be a candidate to fill.
The former Real Madrid man has said his goodbyes to his team-mates at the Emirates Stadium, report Sky Sports, and spoke upon his arrival to Turkey as he prepares for his Fenerbahce medical.
READ MORE: Premier League fixtures and table - all matches by date and kick-off time
“I am very excited because I was always a fan of Fenerbahce. My dream comes true,” he said.
“I am very excited to wear the Fenerbahce jersey. I hope we will be very successful with my team-mates.”
Ozil further explained he hopes to repay the fans’ support with his performances on the pitch, though as it has been 10 months since he last participated in a competitive game he could potentially have to wait for a debut.
Talking to Turkish outlet NTV, Ozil acknowledged he is “missing a few matches” but says he is “physically fit” and “excited” about joining the club he is a fan of.
His current club Arsenal are in action on Monday night against Newcastle in the Premier League, hoping to move into the top half of the table with a victory.
The Gunners won the FA Cup at the end of last season and are on a four-match unbeaten streak in the league, but have largely unimpressed this season with a lack of creativity leading to calls from some quarters to reinstate Ozil to the team.
Arsenal knocked Newcastle out of the FA Cup last weekend, with Smith Rowe netting a decisive goal.
Read More
How to watch Arsenal vs Newcastle online and on TV tonight
Arteta concerned Arsenal players are suffering from burnout
City the only winners as Liverpool and United pay price for timidity
