
 Yahoo Finance
 Is Mercury NZ Limited's (NZSE:MCY) Stock On A Downtrend As A Result Of Its Poor Financials?
It is hard to get excited after looking at Mercury NZ's (NZSE:MCY) recent performance, when its stock has declined 3.4% over the past week. We decided to study the company's financials to determine if the downtrend will continue as the long-term performance of a company usually dictates market outcomes. In this article, we decided to focus on Mercury NZ's ROE.
Return on equity or ROE is an important factor to be considered by a shareholder because it tells them how effectively their capital is being reinvested. In other words, it is a profitability ratio which measures the rate of return on the capital provided by the company's shareholders.
Check out our latest analysis for Mercury NZ
How To Calculate Return On Equity?
The formula for ROE is:
Return on Equity = Net Profit (from continuing operations) ÷ Shareholders' Equity
So, based on the above formula, the ROE for Mercury NZ is:
0.8% = NZ$38m ÷ NZ$4.8b (Based on the trailing twelve months to December 2023).
The 'return' is the profit over the last twelve months. Another way to think of that is that for every NZ$1 worth of equity, the company was able to earn NZ$0.01 in profit.
Why Is ROE Important For Earnings Growth?
So far, we've learned that ROE is a measure of a company's profitability. Based on how much of its profits the company chooses to reinvest or "retain", we are then able to evaluate a company's future ability to generate profits. Assuming everything else remains unchanged, the higher the ROE and profit retention, the higher the growth rate of a company compared to companies that don't necessarily bear these characteristics.
Mercury NZ's Earnings Growth And 0.8% ROE
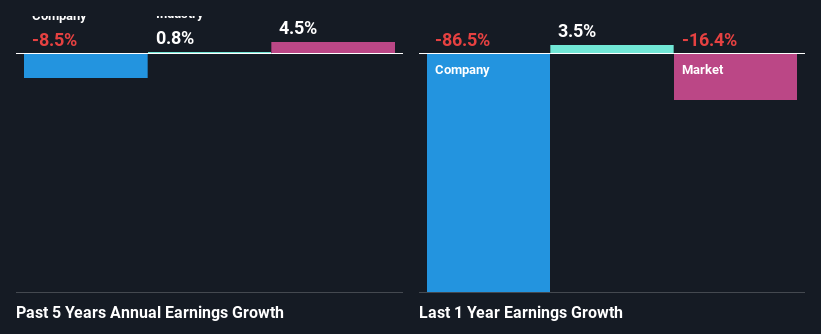
It is hard to argue that Mercury NZ's ROE is much good in and of itself. Even when compared to the industry average of 8.7%, the ROE figure is pretty disappointing. Given the circumstances, the significant decline in net income by 8.5% seen by Mercury NZ over the last five years is not surprising. However, there could also be other factors causing the earnings to decline. For example, the business has allocated capital poorly, or that the company has a very high payout ratio.
That being said, we compared Mercury NZ's performance with the industry and were concerned when we found that while the company has shrunk its earnings, the industry has grown its earnings at a rate of 0.8% in the same 5-year period.
Earnings growth is an important metric to consider when valuing a stock. What investors need to determine next is if the expected earnings growth, or the lack of it, is already built into the share price. By doing so, they will have an idea if the stock is headed into clear blue waters or if swampy waters await. One good indicator of expected earnings growth is the P/E ratio which determines the price the market is willing to pay for a stock based on its earnings prospects. So, you may want to check if Mercury NZ is trading on a high P/E or a low P/E, relative to its industry.
Is Mercury NZ Efficiently Re-investing Its Profits?
Mercury NZ's high three-year median payout ratio of 102% suggests that the company is depleting its resources to keep up its dividend payments, and this shows in its shrinking earnings. Paying a dividend higher than reported profits is not a sustainable move. To know the 4 risks we have identified for Mercury NZ visit our risks dashboard for free.
Moreover, Mercury NZ has been paying dividends for at least ten years or more suggesting that management must have perceived that the shareholders prefer dividends over earnings growth. Looking at the current analyst consensus data, we can see that the company's future payout ratio is expected to rise to 127% over the next three years. Still, forecasts suggest that Mercury NZ's future ROE will rise to 6.7% even though the the company's payout ratio is expected to rise. We presume that there could some other characteristics of the business that could be driving the anticipated growth in the company's ROE.
Conclusion
Overall, we would be extremely cautious before making any decision on Mercury NZ. Specifically, it has shown quite an unsatisfactory performance as far as earnings growth is concerned, and a poor ROE and an equally poor rate of reinvestment seem to be the reason behind this inadequate performance. With that said, we studied the latest analyst forecasts and found that while the company has shrunk its earnings in the past, analysts expect its earnings to grow in the future. To know more about the latest analysts predictions for the company, check out this visualization of analyst forecasts for the company.
Have feedback on this article? Concerned about the content? Get in touch with us directly. Alternatively, email editorial-team (at) simplywallst.com.
This article by Simply Wall St is general in nature. We provide commentary based on historical data and analyst forecasts only using an unbiased methodology and our articles are not intended to be financial advice. It does not constitute a recommendation to buy or sell any stock, and does not take account of your objectives, or your financial situation. We aim to bring you long-term focused analysis driven by fundamental data. Note that our analysis may not factor in the latest price-sensitive company announcements or qualitative material. Simply Wall St has no position in any stocks mentioned.
