
 Yahoo Finance
 McGrath (ASX:MEA) shareholder returns have been impressive, earning 123% in 5 years
When we invest, we're generally looking for stocks that outperform the market average. And in our experience, buying the right stocks can give your wealth a significant boost. For example, the McGrath Limited (ASX:MEA) share price is up 81% in the last 5 years, clearly besting the market return of around 24% (ignoring dividends). On the other hand, the more recent gains haven't been so impressive, with shareholders gaining just 41% , including dividends .
Since the stock has added AU$10m to its market cap in the past week alone, let's see if underlying performance has been driving long-term returns.
See our latest analysis for McGrath
To quote Buffett, 'Ships will sail around the world but the Flat Earth Society will flourish. There will continue to be wide discrepancies between price and value in the marketplace...' One imperfect but simple way to consider how the market perception of a company has shifted is to compare the change in the earnings per share (EPS) with the share price movement.
During the five years of share price growth, McGrath moved from a loss to profitability. That's generally thought to be a genuine positive, so we would expect to see an increasing share price. Since the company was unprofitable five years ago, but not three years ago, it's worth taking a look at the returns in the last three years, too. In fact, the McGrath stock price is 12% lower in the last three years. During the same period, EPS grew by 108% each year. It would appear there's a real mismatch between the increasing EPS and the share price, which has declined -4% a year for three years.
The image below shows how EPS has tracked over time (if you click on the image you can see greater detail).
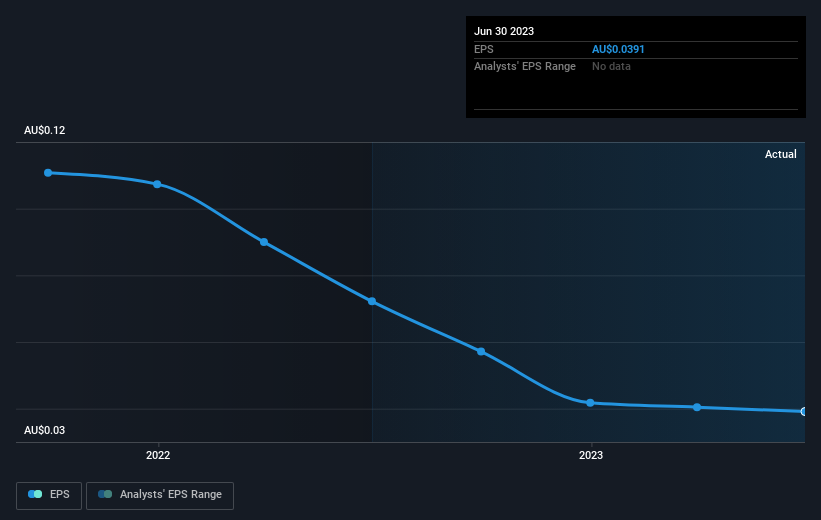
This free interactive report on McGrath's earnings, revenue and cash flow is a great place to start, if you want to investigate the stock further.
What About Dividends?
As well as measuring the share price return, investors should also consider the total shareholder return (TSR). The TSR is a return calculation that accounts for the value of cash dividends (assuming that any dividend received was reinvested) and the calculated value of any discounted capital raisings and spin-offs. So for companies that pay a generous dividend, the TSR is often a lot higher than the share price return. As it happens, McGrath's TSR for the last 5 years was 123%, which exceeds the share price return mentioned earlier. The dividends paid by the company have thusly boosted the total shareholder return.
A Different Perspective
We're pleased to report that McGrath shareholders have received a total shareholder return of 41% over one year. That's including the dividend. Since the one-year TSR is better than the five-year TSR (the latter coming in at 17% per year), it would seem that the stock's performance has improved in recent times. In the best case scenario, this may hint at some real business momentum, implying that now could be a great time to delve deeper. It's always interesting to track share price performance over the longer term. But to understand McGrath better, we need to consider many other factors. For example, we've discovered 3 warning signs for McGrath (1 is significant!) that you should be aware of before investing here.
Of course, you might find a fantastic investment by looking elsewhere. So take a peek at this free list of companies we expect will grow earnings.
Please note, the market returns quoted in this article reflect the market weighted average returns of stocks that currently trade on Australian exchanges.
Have feedback on this article? Concerned about the content? Get in touch with us directly. Alternatively, email editorial-team (at) simplywallst.com.
This article by Simply Wall St is general in nature. We provide commentary based on historical data and analyst forecasts only using an unbiased methodology and our articles are not intended to be financial advice. It does not constitute a recommendation to buy or sell any stock, and does not take account of your objectives, or your financial situation. We aim to bring you long-term focused analysis driven by fundamental data. Note that our analysis may not factor in the latest price-sensitive company announcements or qualitative material. Simply Wall St has no position in any stocks mentioned.
