
 Yahoo Finance
 MBB (ETR:MBB) shareholders have earned a 14% CAGR over the last three years
By buying an index fund, you can roughly match the market return with ease. But if you choose individual stocks with prowess, you can make superior returns. For example, MBB SE (ETR:MBB) shareholders have seen the share price rise 42% over three years, well in excess of the market decline (1.4%, not including dividends).
With that in mind, it's worth seeing if the company's underlying fundamentals have been the driver of long term performance, or if there are some discrepancies.
View our latest analysis for MBB
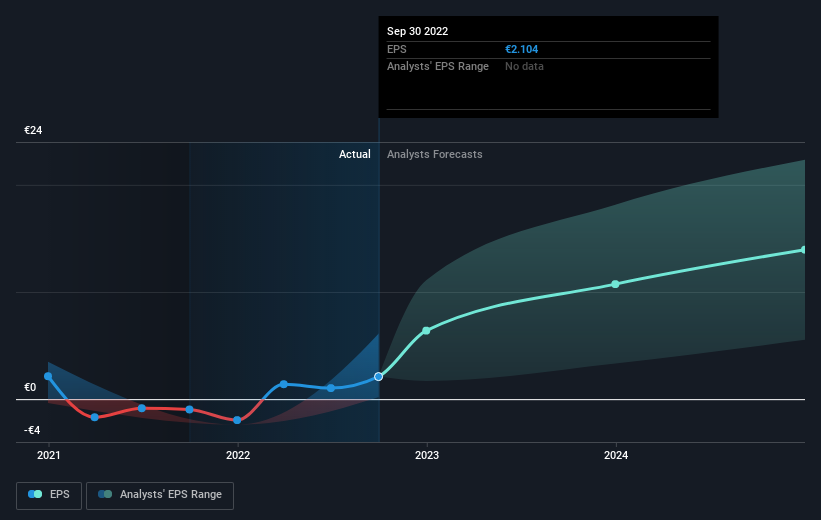
There is no denying that markets are sometimes efficient, but prices do not always reflect underlying business performance. By comparing earnings per share (EPS) and share price changes over time, we can get a feel for how investor attitudes to a company have morphed over time.
MBB became profitable within the last three years. So we would expect a higher share price over the period.
You can see how EPS has changed over time in the image below (click on the chart to see the exact values).
We know that MBB has improved its bottom line lately, but is it going to grow revenue? This free report showing analyst revenue forecasts should help you figure out if the EPS growth can be sustained.
What About Dividends?
It is important to consider the total shareholder return, as well as the share price return, for any given stock. The TSR incorporates the value of any spin-offs or discounted capital raisings, along with any dividends, based on the assumption that the dividends are reinvested. So for companies that pay a generous dividend, the TSR is often a lot higher than the share price return. We note that for MBB the TSR over the last 3 years was 48%, which is better than the share price return mentioned above. This is largely a result of its dividend payments!
A Different Perspective
While the broader market lost about 9.4% in the twelve months, MBB shareholders did even worse, losing 24% (even including dividends). However, it could simply be that the share price has been impacted by broader market jitters. It might be worth keeping an eye on the fundamentals, in case there's a good opportunity. On the bright side, long term shareholders have made money, with a gain of 3% per year over half a decade. If the fundamental data continues to indicate long term sustainable growth, the current sell-off could be an opportunity worth considering. It's always interesting to track share price performance over the longer term. But to understand MBB better, we need to consider many other factors. Consider risks, for instance. Every company has them, and we've spotted 1 warning sign for MBB you should know about.
Of course, you might find a fantastic investment by looking elsewhere. So take a peek at this free list of companies we expect will grow earnings.
Please note, the market returns quoted in this article reflect the market weighted average returns of stocks that currently trade on DE exchanges.
Have feedback on this article? Concerned about the content? Get in touch with us directly. Alternatively, email editorial-team (at) simplywallst.com.
This article by Simply Wall St is general in nature. We provide commentary based on historical data and analyst forecasts only using an unbiased methodology and our articles are not intended to be financial advice. It does not constitute a recommendation to buy or sell any stock, and does not take account of your objectives, or your financial situation. We aim to bring you long-term focused analysis driven by fundamental data. Note that our analysis may not factor in the latest price-sensitive company announcements or qualitative material. Simply Wall St has no position in any stocks mentioned.
Join A Paid User Research Session
You’ll receive a US$30 Amazon Gift card for 1 hour of your time while helping us build better investing tools for the individual investors like yourself. Sign up here
