
 Yahoo Finance
 Is Mayne Pharma Group Limited’s (ASX:MYX) Balance Sheet Strong Enough To Weather A Storm?

Want to participate in a short research study? Help shape the future of investing tools and receive a $20 prize!
Investors are always looking for growth in small-cap stocks like Mayne Pharma Group Limited (ASX:MYX), with a market cap of AU$1.3b. However, an important fact which most ignore is: how financially healthy is the business? Pharmaceuticals companies, especially ones that are currently loss-making, are more likely to be higher risk. Evaluating financial health as part of your investment thesis is essential. Here are a few basic checks that are good enough to have a broad overview of the company’s financial strength. Though, I know these factors are very high-level, so I’d encourage you to dig deeper yourself into MYX here.
How does MYX’s operating cash flow stack up against its debt?
MYX’s debt levels surged from AU$340m to AU$374m over the last 12 months – this includes long-term debt. With this growth in debt, MYX currently has AU$102m remaining in cash and short-term investments , ready to deploy into the business. Additionally, MYX has produced AU$121m in operating cash flow over the same time period, resulting in an operating cash to total debt ratio of 32%, signalling that MYX’s debt is appropriately covered by operating cash. This ratio can also be interpreted as a measure of efficiency for loss making companies as traditional metrics such as return on asset (ROA) requires a positive net income. In MYX’s case, it is able to generate 0.32x cash from its debt capital.
Can MYX pay its short-term liabilities?
Looking at MYX’s AU$180m in current liabilities, the company has been able to meet these obligations given the level of current assets of AU$481m, with a current ratio of 2.67x. Generally, for Pharmaceuticals companies, this is a reasonable ratio since there is a bit of a cash buffer without leaving too much capital in a low-return environment.
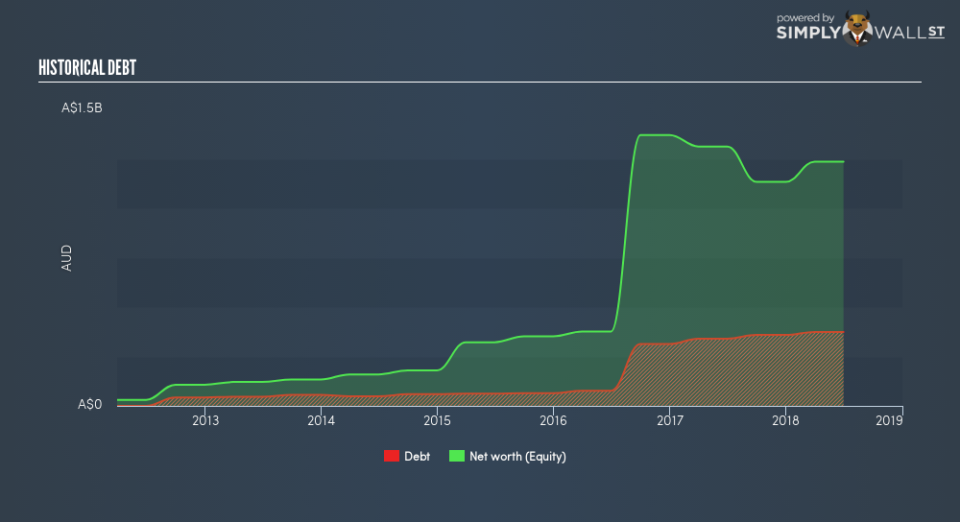
Does MYX face the risk of succumbing to its debt-load?
With debt at 30% of equity, MYX may be thought of as appropriately levered. MYX is not taking on too much debt commitment, which may be constraining for future growth. Risk around debt is very low for MYX, and the company also has the ability and headroom to increase debt if needed going forward.
Next Steps:
MYX’s debt level is appropriate for a company its size, and it is also able to generate sufficient cash flow coverage, meaning it has been able to put its debt in good use. Furthermore, the company exhibits proper management of current assets and upcoming liabilities. I admit this is a fairly basic analysis for MYX’s financial health. Other important fundamentals need to be considered alongside. You should continue to research Mayne Pharma Group to get a more holistic view of the stock by looking at:
Future Outlook: What are well-informed industry analysts predicting for MYX’s future growth? Take a look at our free research report of analyst consensus for MYX’s outlook.
Valuation: What is MYX worth today? Is the stock undervalued, even when its growth outlook is factored into its intrinsic value? The intrinsic value infographic in our free research report helps visualize whether MYX is currently mispriced by the market.
Other High-Performing Stocks: Are there other stocks that provide better prospects with proven track records? Explore our free list of these great stocks here.
We aim to bring you long-term focused research analysis driven by fundamental data. Note that our analysis may not factor in the latest price-sensitive company announcements or qualitative material.
If you spot an error that warrants correction, please contact the editor at editorial-team@simplywallst.com. This article by Simply Wall St is general in nature. It does not constitute a recommendation to buy or sell any stock, and does not take account of your objectives, or your financial situation. Simply Wall St has no position in the stocks mentioned. On rare occasion, data errors may occur. Thank you for reading.
