
 Yahoo Finance
 Are Marshalls plc (LON:MSLH) Investors Paying Above The Intrinsic Value?
Today we'll do a simple run through of a valuation method used to estimate the attractiveness of Marshalls plc (LON:MSLH) as an investment opportunity by taking the expected future cash flows and discounting them to today's value. This will be done using the Discounted Cash Flow (DCF) model. There's really not all that much to it, even though it might appear quite complex.
Remember though, that there are many ways to estimate a company's value, and a DCF is just one method. If you still have some burning questions about this type of valuation, take a look at the Simply Wall St analysis model.
Check out our latest analysis for Marshalls
Step by step through the calculation
We're using the 2-stage growth model, which simply means we take in account two stages of company's growth. In the initial period the company may have a higher growth rate and the second stage is usually assumed to have a stable growth rate. To start off with, we need to estimate the next ten years of cash flows. Where possible we use analyst estimates, but when these aren't available we extrapolate the previous free cash flow (FCF) from the last estimate or reported value. We assume companies with shrinking free cash flow will slow their rate of shrinkage, and that companies with growing free cash flow will see their growth rate slow, over this period. We do this to reflect that growth tends to slow more in the early years than it does in later years.
A DCF is all about the idea that a dollar in the future is less valuable than a dollar today, and so the sum of these future cash flows is then discounted to today's value:
10-year free cash flow (FCF) estimate
2021 | 2022 | 2023 | 2024 | 2025 | 2026 | 2027 | 2028 | 2029 | 2030 | |
Levered FCF (£, Millions) | UK£32.3m | UK£42.5m | UK£47.8m | UK£51.5m | UK£54.5m | UK£56.9m | UK£58.8m | UK£60.3m | UK£61.6m | UK£62.7m |
Growth Rate Estimate Source | Analyst x3 | Analyst x3 | Analyst x2 | Est @ 7.81% | Est @ 5.77% | Est @ 4.34% | Est @ 3.34% | Est @ 2.64% | Est @ 2.15% | Est @ 1.8% |
Present Value (£, Millions) Discounted @ 5.9% | UK£30.5 | UK£37.9 | UK£40.2 | UK£40.9 | UK£40.9 | UK£40.3 | UK£39.3 | UK£38.1 | UK£36.7 | UK£35.3 |
("Est" = FCF growth rate estimated by Simply Wall St)
Present Value of 10-year Cash Flow (PVCF) = UK£379m
The second stage is also known as Terminal Value, this is the business's cash flow after the first stage. For a number of reasons a very conservative growth rate is used that cannot exceed that of a country's GDP growth. In this case we have used the 5-year average of the 10-year government bond yield (1.0%) to estimate future growth. In the same way as with the 10-year 'growth' period, we discount future cash flows to today's value, using a cost of equity of 5.9%.
Terminal Value (TV)= FCF2030 × (1 + g) ÷ (r – g) = UK£63m× (1 + 1.0%) ÷ (5.9%– 1.0%) = UK£1.3b
Present Value of Terminal Value (PVTV)= TV / (1 + r)10= UK£1.3b÷ ( 1 + 5.9%)10= UK£723m
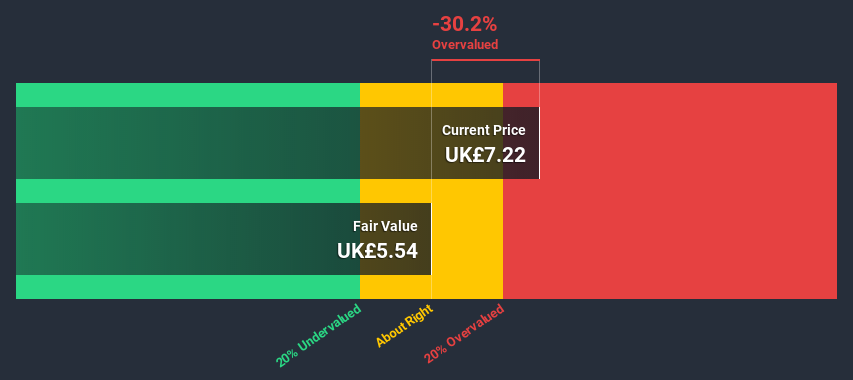
The total value, or equity value, is then the sum of the present value of the future cash flows, which in this case is UK£1.1b. To get the intrinsic value per share, we divide this by the total number of shares outstanding. Relative to the current share price of UK£7.2, the company appears potentially overvalued at the time of writing. The assumptions in any calculation have a big impact on the valuation, so it is better to view this as a rough estimate, not precise down to the last cent.
Important assumptions
The calculation above is very dependent on two assumptions. The first is the discount rate and the other is the cash flows. Part of investing is coming up with your own evaluation of a company's future performance, so try the calculation yourself and check your own assumptions. The DCF also does not consider the possible cyclicality of an industry, or a company's future capital requirements, so it does not give a full picture of a company's potential performance. Given that we are looking at Marshalls as potential shareholders, the cost of equity is used as the discount rate, rather than the cost of capital (or weighted average cost of capital, WACC) which accounts for debt. In this calculation we've used 5.9%, which is based on a levered beta of 0.827. Beta is a measure of a stock's volatility, compared to the market as a whole. We get our beta from the industry average beta of globally comparable companies, with an imposed limit between 0.8 and 2.0, which is a reasonable range for a stable business.
Moving On:
Although the valuation of a company is important, it shouldn't be the only metric you look at when researching a company. DCF models are not the be-all and end-all of investment valuation. Instead the best use for a DCF model is to test certain assumptions and theories to see if they would lead to the company being undervalued or overvalued. For instance, if the terminal value growth rate is adjusted slightly, it can dramatically alter the overall result. Can we work out why the company is trading at a premium to intrinsic value? For Marshalls, there are three relevant items you should further examine:
Risks: Take risks, for example - Marshalls has 4 warning signs (and 1 which is a bit concerning) we think you should know about.
Management:Have insiders been ramping up their shares to take advantage of the market's sentiment for MSLH's future outlook? Check out our management and board analysis with insights on CEO compensation and governance factors.
Other High Quality Alternatives: Do you like a good all-rounder? Explore our interactive list of high quality stocks to get an idea of what else is out there you may be missing!
PS. The Simply Wall St app conducts a discounted cash flow valuation for every stock on the LSE every day. If you want to find the calculation for other stocks just search here.
This article by Simply Wall St is general in nature. It does not constitute a recommendation to buy or sell any stock, and does not take account of your objectives, or your financial situation. We aim to bring you long-term focused analysis driven by fundamental data. Note that our analysis may not factor in the latest price-sensitive company announcements or qualitative material. Simply Wall St has no position in any stocks mentioned.
Have feedback on this article? Concerned about the content? Get in touch with us directly. Alternatively, email editorial-team (at) simplywallst.com.
