
 Yahoo Finance
 Market Cool On Frontier Group Holdings, Inc.'s (NASDAQ:ULCC) Revenues
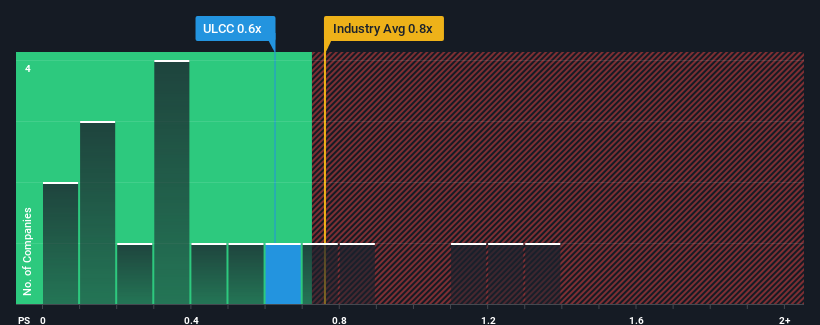
It's not a stretch to say that Frontier Group Holdings, Inc.'s (NASDAQ:ULCC) price-to-sales (or "P/S") ratio of 0.6x right now seems quite "middle-of-the-road" for companies in the Airlines industry in the United States, where the median P/S ratio is around 0.4x. Although, it's not wise to simply ignore the P/S without explanation as investors may be disregarding a distinct opportunity or a costly mistake.
View our latest analysis for Frontier Group Holdings
What Does Frontier Group Holdings' P/S Mean For Shareholders?
There hasn't been much to differentiate Frontier Group Holdings' and the industry's revenue growth lately. The P/S ratio is probably moderate because investors think this modest revenue performance will continue. Those who are bullish on Frontier Group Holdings will be hoping that revenue performance can pick up, so that they can pick up the stock at a slightly lower valuation.
If you'd like to see what analysts are forecasting going forward, you should check out our free report on Frontier Group Holdings.
Do Revenue Forecasts Match The P/S Ratio?
There's an inherent assumption that a company should be matching the industry for P/S ratios like Frontier Group Holdings' to be considered reasonable.
Taking a look back first, we see that the company grew revenue by an impressive 61% last year. The latest three year period has also seen an excellent 33% overall rise in revenue, aided by its short-term performance. Therefore, it's fair to say the revenue growth recently has been superb for the company.
Shifting to the future, estimates from the ten analysts covering the company suggest revenue should grow by 15% per year over the next three years. That's shaping up to be materially higher than the 7.7% each year growth forecast for the broader industry.
With this in consideration, we find it intriguing that Frontier Group Holdings' P/S is closely matching its industry peers. It may be that most investors aren't convinced the company can achieve future growth expectations.
The Bottom Line On Frontier Group Holdings' P/S
Typically, we'd caution against reading too much into price-to-sales ratios when settling on investment decisions, though it can reveal plenty about what other market participants think about the company.
Despite enticing revenue growth figures that outpace the industry, Frontier Group Holdings' P/S isn't quite what we'd expect. Perhaps uncertainty in the revenue forecasts are what's keeping the P/S ratio consistent with the rest of the industry. It appears some are indeed anticipating revenue instability, because these conditions should normally provide a boost to the share price.
Don't forget that there may be other risks. For instance, we've identified 1 warning sign for Frontier Group Holdings that you should be aware of.
If these risks are making you reconsider your opinion on Frontier Group Holdings, explore our interactive list of high quality stocks to get an idea of what else is out there.
Have feedback on this article? Concerned about the content? Get in touch with us directly. Alternatively, email editorial-team (at) simplywallst.com.
This article by Simply Wall St is general in nature. We provide commentary based on historical data and analyst forecasts only using an unbiased methodology and our articles are not intended to be financial advice. It does not constitute a recommendation to buy or sell any stock, and does not take account of your objectives, or your financial situation. We aim to bring you long-term focused analysis driven by fundamental data. Note that our analysis may not factor in the latest price-sensitive company announcements or qualitative material. Simply Wall St has no position in any stocks mentioned.
Join A Paid User Research Session
You’ll receive a US$30 Amazon Gift card for 1 hour of your time while helping us build better investing tools for the individual investors like yourself. Sign up here
