
 Yahoo Finance
 A-Mark Precious Metals' (NASDAQ:AMRK) three-year total shareholder returns outpace the underlying earnings growth
A-Mark Precious Metals, Inc. (NASDAQ:AMRK) shareholders might be concerned after seeing the share price drop 27% in the last month. But that doesn't displace its brilliant performance over three years. The longer term view reveals that the share price is up 322% in that period. Arguably, the recent fall is to be expected after such a strong rise. The only way to form a view of whether the current price is justified is to consider the merits of the business itself.
While this past week has detracted from the company's three-year return, let's look at the recent trends of the underlying business and see if the gains have been in alignment.
View our latest analysis for A-Mark Precious Metals
While markets are a powerful pricing mechanism, share prices reflect investor sentiment, not just underlying business performance. By comparing earnings per share (EPS) and share price changes over time, we can get a feel for how investor attitudes to a company have morphed over time.
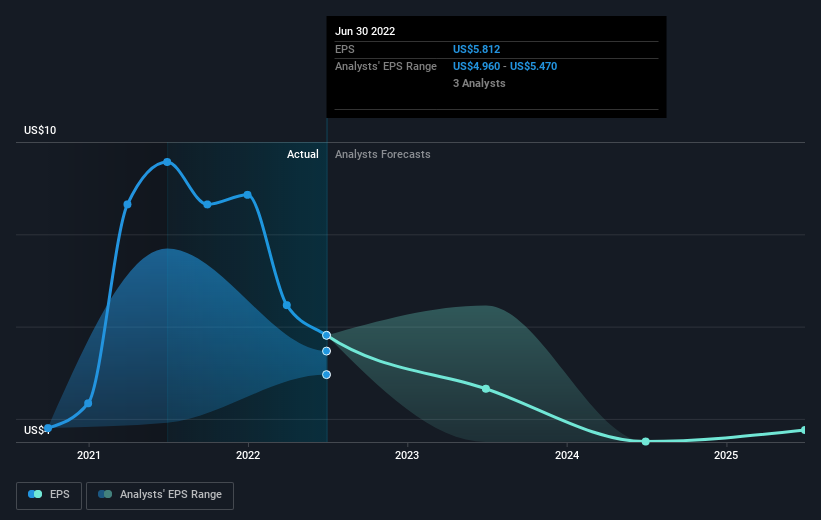
A-Mark Precious Metals was able to grow its EPS at 230% per year over three years, sending the share price higher. The average annual share price increase of 62% is actually lower than the EPS growth. So it seems investors have become more cautious about the company, over time. We'd venture the lowish P/E ratio of 4.48 also reflects the negative sentiment around the stock.
You can see below how EPS has changed over time (discover the exact values by clicking on the image).
We consider it positive that insiders have made significant purchases in the last year. Even so, future earnings will be far more important to whether current shareholders make money. Before buying or selling a stock, we always recommend a close examination of historic growth trends, available here..
What About Dividends?
As well as measuring the share price return, investors should also consider the total shareholder return (TSR). Whereas the share price return only reflects the change in the share price, the TSR includes the value of dividends (assuming they were reinvested) and the benefit of any discounted capital raising or spin-off. It's fair to say that the TSR gives a more complete picture for stocks that pay a dividend. As it happens, A-Mark Precious Metals' TSR for the last 3 years was 397%, which exceeds the share price return mentioned earlier. The dividends paid by the company have thusly boosted the total shareholder return.
A Different Perspective
While it's never nice to take a loss, A-Mark Precious Metals shareholders can take comfort that , including dividends,their trailing twelve month loss of 8.4% wasn't as bad as the market loss of around 17%. Longer term investors wouldn't be so upset, since they would have made 29%, each year, over five years. It could be that the business is just facing some short term problems, but shareholders should keep a close eye on the fundamentals. It's always interesting to track share price performance over the longer term. But to understand A-Mark Precious Metals better, we need to consider many other factors. Consider for instance, the ever-present spectre of investment risk. We've identified 5 warning signs with A-Mark Precious Metals (at least 3 which are potentially serious) , and understanding them should be part of your investment process.
A-Mark Precious Metals is not the only stock that insiders are buying. For those who like to find winning investments this free list of growing companies with recent insider purchasing, could be just the ticket.
Please note, the market returns quoted in this article reflect the market weighted average returns of stocks that currently trade on US exchanges.
Have feedback on this article? Concerned about the content? Get in touch with us directly. Alternatively, email editorial-team (at) simplywallst.com.
This article by Simply Wall St is general in nature. We provide commentary based on historical data and analyst forecasts only using an unbiased methodology and our articles are not intended to be financial advice. It does not constitute a recommendation to buy or sell any stock, and does not take account of your objectives, or your financial situation. We aim to bring you long-term focused analysis driven by fundamental data. Note that our analysis may not factor in the latest price-sensitive company announcements or qualitative material. Simply Wall St has no position in any stocks mentioned.
Join A Paid User Research Session
You’ll receive a US$30 Amazon Gift card for 1 hour of your time while helping us build better investing tools for the individual investors like yourself. Sign up here
