
 Yahoo Finance
 Many Would Be Envious Of James Hardie Industries' (ASX:JHX) Excellent Returns On Capital
If you're not sure where to start when looking for the next multi-bagger, there are a few key trends you should keep an eye out for. One common approach is to try and find a company with returns on capital employed (ROCE) that are increasing, in conjunction with a growing amount of capital employed. If you see this, it typically means it's a company with a great business model and plenty of profitable reinvestment opportunities. That's why when we briefly looked at James Hardie Industries' (ASX:JHX) ROCE trend, we were very happy with what we saw.
Understanding Return On Capital Employed (ROCE)
For those that aren't sure what ROCE is, it measures the amount of pre-tax profits a company can generate from the capital employed in its business. To calculate this metric for James Hardie Industries, this is the formula:
Return on Capital Employed = Earnings Before Interest and Tax (EBIT) ÷ (Total Assets - Current Liabilities)
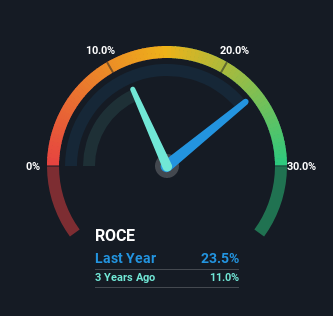
0.23 = US$815m ÷ (US$4.2b - US$770m) (Based on the trailing twelve months to March 2022).
Therefore, James Hardie Industries has an ROCE of 23%. In absolute terms that's a great return and it's even better than the Basic Materials industry average of 8.0%.
View our latest analysis for James Hardie Industries
In the above chart we have measured James Hardie Industries' prior ROCE against its prior performance, but the future is arguably more important. If you'd like to see what analysts are forecasting going forward, you should check out our free report for James Hardie Industries.
What The Trend Of ROCE Can Tell Us
James Hardie Industries deserves to be commended in regards to it's returns. The company has consistently earned 23% for the last five years, and the capital employed within the business has risen 119% in that time. With returns that high, it's great that the business can continually reinvest its money at such appealing rates of return. If James Hardie Industries can keep this up, we'd be very optimistic about its future.
What We Can Learn From James Hardie Industries' ROCE
In short, we'd argue James Hardie Industries has the makings of a multi-bagger since its been able to compound its capital at very profitable rates of return. And the stock has followed suit returning a meaningful 63% to shareholders over the last five years. So even though the stock might be more "expensive" than it was before, we think the strong fundamentals warrant this stock for further research.
One more thing to note, we've identified 3 warning signs with James Hardie Industries and understanding them should be part of your investment process.
If you want to search for more stocks that have been earning high returns, check out this free list of stocks with solid balance sheets that are also earning high returns on equity.
Have feedback on this article? Concerned about the content? Get in touch with us directly. Alternatively, email editorial-team (at) simplywallst.com.
This article by Simply Wall St is general in nature. We provide commentary based on historical data and analyst forecasts only using an unbiased methodology and our articles are not intended to be financial advice. It does not constitute a recommendation to buy or sell any stock, and does not take account of your objectives, or your financial situation. We aim to bring you long-term focused analysis driven by fundamental data. Note that our analysis may not factor in the latest price-sensitive company announcements or qualitative material. Simply Wall St has no position in any stocks mentioned.
