
 Yahoo Finance
 Macmahon Holdings (ASX:MAH) investors are sitting on a loss of 28% if they invested five years ago
Ideally, your overall portfolio should beat the market average. But even the best stock picker will only win with some selections. At this point some shareholders may be questioning their investment in Macmahon Holdings Limited (ASX:MAH), since the last five years saw the share price fall 40%.
It's worthwhile assessing if the company's economics have been moving in lockstep with these underwhelming shareholder returns, or if there is some disparity between the two. So let's do just that.
Check out our latest analysis for Macmahon Holdings
While the efficient markets hypothesis continues to be taught by some, it has been proven that markets are over-reactive dynamic systems, and investors are not always rational. One flawed but reasonable way to assess how sentiment around a company has changed is to compare the earnings per share (EPS) with the share price.
During the unfortunate half decade during which the share price slipped, Macmahon Holdings actually saw its earnings per share (EPS) improve by 12% per year. Given the share price reaction, one might suspect that EPS is not a good guide to the business performance during the period (perhaps due to a one-off loss or gain). Or possibly, the market was previously very optimistic, so the stock has disappointed, despite improving EPS.
Because of the sharp contrast between the EPS growth rate and the share price growth, we're inclined to look to other metrics to understand the changing market sentiment around the stock.
The steady dividend doesn't really explain why the share price is down. It's not immediately clear to us why the stock price is down but further research might provide some answers.
The company's revenue and earnings (over time) are depicted in the image below (click to see the exact numbers).
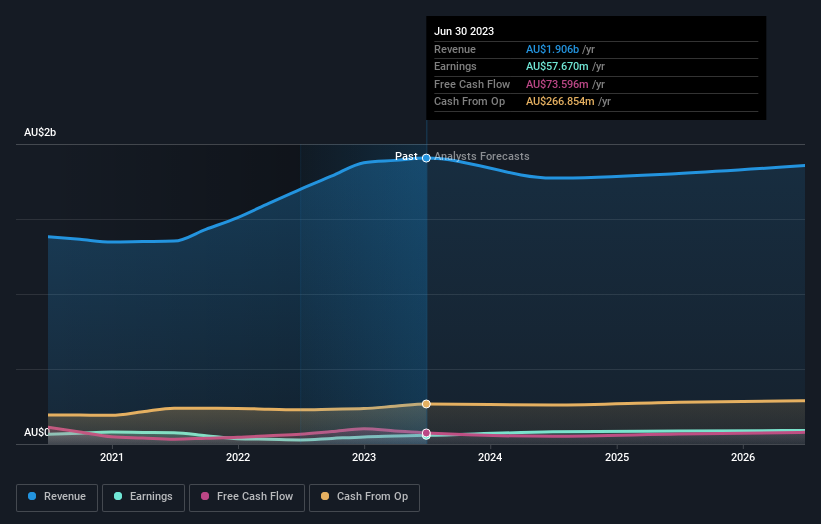
We know that Macmahon Holdings has improved its bottom line lately, but what does the future have in store? You can see what analysts are predicting for Macmahon Holdings in this interactive graph of future profit estimates.
What About Dividends?
It is important to consider the total shareholder return, as well as the share price return, for any given stock. The TSR incorporates the value of any spin-offs or discounted capital raisings, along with any dividends, based on the assumption that the dividends are reinvested. So for companies that pay a generous dividend, the TSR is often a lot higher than the share price return. We note that for Macmahon Holdings the TSR over the last 5 years was -28%, which is better than the share price return mentioned above. And there's no prize for guessing that the dividend payments largely explain the divergence!
A Different Perspective
It's nice to see that Macmahon Holdings shareholders have received a total shareholder return of 12% over the last year. And that does include the dividend. Notably the five-year annualised TSR loss of 5% per year compares very unfavourably with the recent share price performance. This makes us a little wary, but the business might have turned around its fortunes. It's always interesting to track share price performance over the longer term. But to understand Macmahon Holdings better, we need to consider many other factors. To that end, you should be aware of the 1 warning sign we've spotted with Macmahon Holdings .
If you would prefer to check out another company -- one with potentially superior financials -- then do not miss this free list of companies that have proven they can grow earnings.
Please note, the market returns quoted in this article reflect the market weighted average returns of stocks that currently trade on Australian exchanges.
Have feedback on this article? Concerned about the content? Get in touch with us directly. Alternatively, email editorial-team (at) simplywallst.com.
This article by Simply Wall St is general in nature. We provide commentary based on historical data and analyst forecasts only using an unbiased methodology and our articles are not intended to be financial advice. It does not constitute a recommendation to buy or sell any stock, and does not take account of your objectives, or your financial situation. We aim to bring you long-term focused analysis driven by fundamental data. Note that our analysis may not factor in the latest price-sensitive company announcements or qualitative material. Simply Wall St has no position in any stocks mentioned.
