
 Yahoo Finance
 Mackenzie Master Limited Partnership (TSE:MKZ.UN) shareholders have earned a 8.7% CAGR over the last five years
For many, the main point of investing is to generate higher returns than the overall market. But every investor is virtually certain to have both over-performing and under-performing stocks. So we wouldn't blame long term Mackenzie Master Limited Partnership (TSE:MKZ.UN) shareholders for doubting their decision to hold, with the stock down 21% over a half decade.
Now let's have a look at the company's fundamentals, and see if the long term shareholder return has matched the performance of the underlying business.
See our latest analysis for Mackenzie Master Limited Partnership
To paraphrase Benjamin Graham: Over the short term the market is a voting machine, but over the long term it's a weighing machine. One flawed but reasonable way to assess how sentiment around a company has changed is to compare the earnings per share (EPS) with the share price.
During the five years over which the share price declined, Mackenzie Master Limited Partnership's earnings per share (EPS) dropped by 10% each year. The share price decline of 5% per year isn't as bad as the EPS decline. The relatively muted share price reaction might be because the market expects the business to turn around.
The company's earnings per share (over time) is depicted in the image below (click to see the exact numbers).
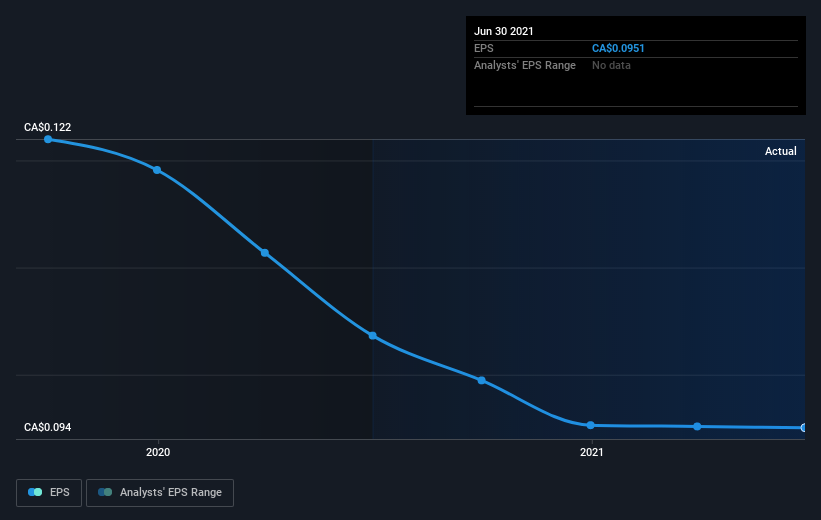
This free interactive report on Mackenzie Master Limited Partnership's earnings, revenue and cash flow is a great place to start, if you want to investigate the stock further.
What About Dividends?
As well as measuring the share price return, investors should also consider the total shareholder return (TSR). The TSR incorporates the value of any spin-offs or discounted capital raisings, along with any dividends, based on the assumption that the dividends are reinvested. Arguably, the TSR gives a more comprehensive picture of the return generated by a stock. We note that for Mackenzie Master Limited Partnership the TSR over the last 5 years was 52%, which is better than the share price return mentioned above. The dividends paid by the company have thusly boosted the total shareholder return.
A Different Perspective
Mackenzie Master Limited Partnership shareholders gained a total return of 8.9% during the year. But that was short of the market average. The silver lining is that the gain was actually better than the average annual return of 9% per year over five year. This suggests the company might be improving over time. I find it very interesting to look at share price over the long term as a proxy for business performance. But to truly gain insight, we need to consider other information, too. Consider for instance, the ever-present spectre of investment risk. We've identified 4 warning signs with Mackenzie Master Limited Partnership (at least 3 which are a bit unpleasant) , and understanding them should be part of your investment process.
For those who like to find winning investments this free list of growing companies with recent insider purchasing, could be just the ticket.
Please note, the market returns quoted in this article reflect the market weighted average returns of stocks that currently trade on CA exchanges.
This article by Simply Wall St is general in nature. We provide commentary based on historical data and analyst forecasts only using an unbiased methodology and our articles are not intended to be financial advice. It does not constitute a recommendation to buy or sell any stock, and does not take account of your objectives, or your financial situation. We aim to bring you long-term focused analysis driven by fundamental data. Note that our analysis may not factor in the latest price-sensitive company announcements or qualitative material. Simply Wall St has no position in any stocks mentioned.
Have feedback on this article? Concerned about the content? Get in touch with us directly. Alternatively, email editorial-team (at) simplywallst.com.
