
 Yahoo Finance
 What Is M.D.C. Holdings's (NYSE:MDC) P/E Ratio After Its Share Price Tanked?

To the annoyance of some shareholders, M.D.C. Holdings (NYSE:MDC) shares are down a considerable 39% in the last month. The recent drop has obliterated the annual return, with the share price now down 5.4% over that longer period.
Assuming nothing else has changed, a lower share price makes a stock more attractive to potential buyers. While the market sentiment towards a stock is very changeable, in the long run, the share price will tend to move in the same direction as earnings per share. So, on certain occasions, long term focussed investors try to take advantage of pessimistic expectations to buy shares at a better price. Perhaps the simplest way to get a read on investors' expectations of a business is to look at its Price to Earnings Ratio (PE Ratio). Investors have optimistic expectations of companies with higher P/E ratios, compared to companies with lower P/E ratios.
View our latest analysis for M.D.C. Holdings
Does M.D.C. Holdings Have A Relatively High Or Low P/E For Its Industry?
We can tell from its P/E ratio of 7.01 that sentiment around M.D.C. Holdings isn't particularly high. If you look at the image below, you can see M.D.C. Holdings has a lower P/E than the average (8.3) in the consumer durables industry classification.
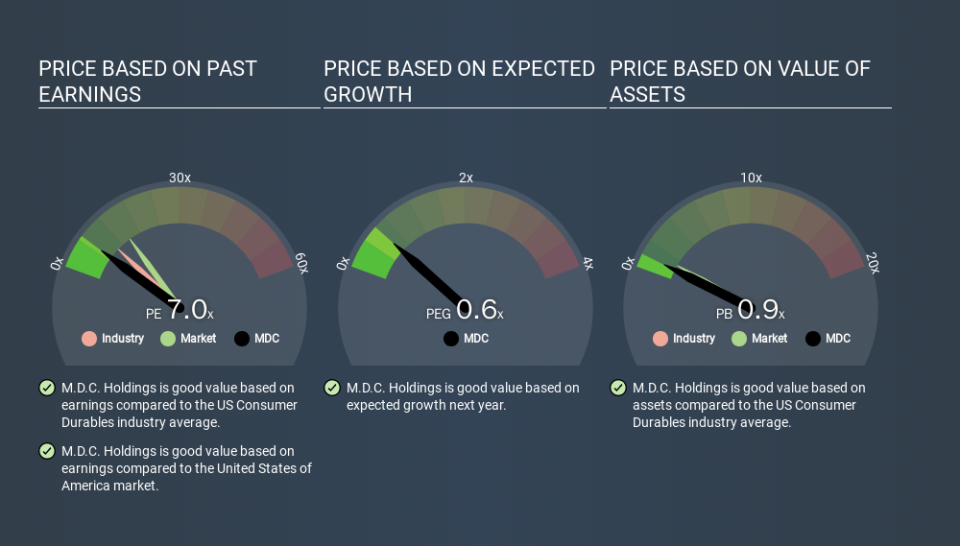
Its relatively low P/E ratio indicates that M.D.C. Holdings shareholders think it will struggle to do as well as other companies in its industry classification. Since the market seems unimpressed with M.D.C. Holdings, it's quite possible it could surprise on the upside. It is arguably worth checking if insiders are buying shares, because that might imply they believe the stock is undervalued.
How Growth Rates Impact P/E Ratios
P/E ratios primarily reflect market expectations around earnings growth rates. If earnings are growing quickly, then the 'E' in the equation will increase faster than it would otherwise. That means even if the current P/E is high, it will reduce over time if the share price stays flat. So while a stock may look expensive based on past earnings, it could be cheap based on future earnings.
It's great to see that M.D.C. Holdings grew EPS by 11% in the last year. And it has bolstered its earnings per share by 29% per year over the last five years. So one might expect an above average P/E ratio.
Don't Forget: The P/E Does Not Account For Debt or Bank Deposits
It's important to note that the P/E ratio considers the market capitalization, not the enterprise value. That means it doesn't take debt or cash into account. Theoretically, a business can improve its earnings (and produce a lower P/E in the future) by investing in growth. That means taking on debt (or spending its cash).
Such spending might be good or bad, overall, but the key point here is that you need to look at debt to understand the P/E ratio in context.
So What Does M.D.C. Holdings's Balance Sheet Tell Us?
Net debt is 43% of M.D.C. Holdings's market cap. While it's worth keeping this in mind, it isn't a worry.
The Bottom Line On M.D.C. Holdings's P/E Ratio
M.D.C. Holdings has a P/E of 7.0. That's below the average in the US market, which is 13.3. The EPS growth last year was strong, and debt levels are quite reasonable. If it continues to grow, then the current low P/E may prove to be unjustified. Since analysts are predicting growth will continue, one might expect to see a higher P/E so it may be worth looking closer. Given M.D.C. Holdings's P/E ratio has declined from 11.4 to 7.0 in the last month, we know for sure that the market is more worried about the business today, than it was back then. For those who prefer to invest with the flow of momentum, that might be a bad sign, but for deep value investors this stock might justify some research.
When the market is wrong about a stock, it gives savvy investors an opportunity. If it is underestimating a company, investors can make money by buying and holding the shares until the market corrects itself. So this free visual report on analyst forecasts could hold the key to an excellent investment decision.
You might be able to find a better buy than M.D.C. Holdings. If you want a selection of possible winners, check out this free list of interesting companies that trade on a P/E below 20 (but have proven they can grow earnings).
If you spot an error that warrants correction, please contact the editor at editorial-team@simplywallst.com. This article by Simply Wall St is general in nature. It does not constitute a recommendation to buy or sell any stock, and does not take account of your objectives, or your financial situation. Simply Wall St has no position in the stocks mentioned.
We aim to bring you long-term focused research analysis driven by fundamental data. Note that our analysis may not factor in the latest price-sensitive company announcements or qualitative material. Thank you for reading.
