
 Yahoo Finance
 Loss-Making Open Orphan plc (LON:ORPH) Set To Breakeven
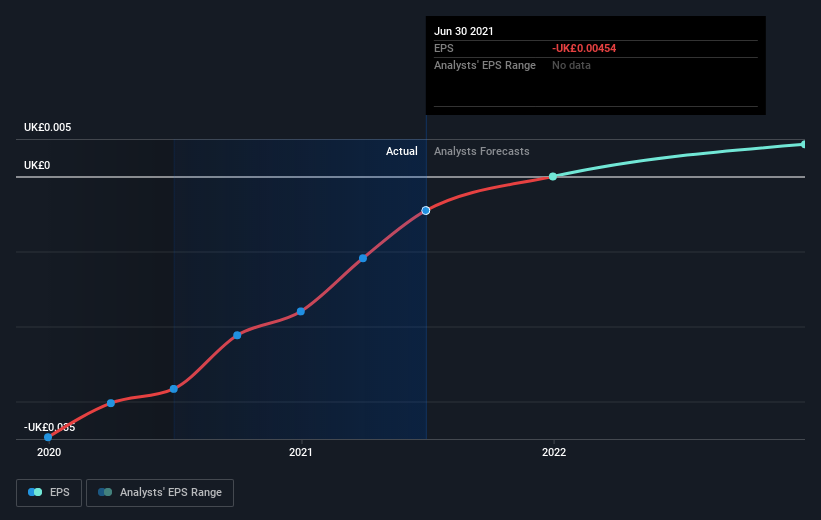
We feel now is a pretty good time to analyse Open Orphan plc's (LON:ORPH) business as it appears the company may be on the cusp of a considerable accomplishment. Open Orphan plc operates as a pharmaceutical service and contract research company. The UK£154m market-cap company’s loss lessened since it announced a UK£11m loss in the full financial year, compared to the latest trailing-twelve-month loss of UK£3.0m, as it approaches breakeven. Many investors are wondering about the rate at which Open Orphan will turn a profit, with the big question being “when will the company breakeven?” In this article, we will touch on the expectations for the company's growth and when analysts expect it to become profitable.
Check out our latest analysis for Open Orphan
Consensus from 2 of the British Life Sciences analysts is that Open Orphan is on the verge of breakeven. They expect the company to post a final loss in 2021, before turning a profit of UK£2.7m in 2022. So, the company is predicted to breakeven approximately a year from now or less! At what rate will the company have to grow in order to realise the consensus estimates forecasting breakeven in under 12 months? Using a line of best fit, we calculated an average annual growth rate of 185%, which is rather optimistic! Should the business grow at a slower rate, it will become profitable at a later date than expected.
Underlying developments driving Open Orphan's growth isn’t the focus of this broad overview, though, bear in mind that by and large a life science company has lumpy cash flows which are contingent on the product and stage of development the company is in. This means, large upcoming growth rates are not abnormal as the company is beginning to reap the benefits of earlier investments.
One thing we’d like to point out is that The company has managed its capital prudently, with debt making up 1.5% of equity. This means that it has predominantly funded its operations from equity capital, and its low debt obligation reduces the risk around investing in the loss-making company.
Next Steps:
There are too many aspects of Open Orphan to cover in one brief article, but the key fundamentals for the company can all be found in one place – Open Orphan's company page on Simply Wall St. We've also compiled a list of pertinent aspects you should further examine:
Valuation: What is Open Orphan worth today? Has the future growth potential already been factored into the price? The intrinsic value infographic in our free research report helps visualize whether Open Orphan is currently mispriced by the market.
Management Team: An experienced management team on the helm increases our confidence in the business – take a look at who sits on Open Orphan’s board and the CEO’s background.
Other High-Performing Stocks: Are there other stocks that provide better prospects with proven track records? Explore our free list of these great stocks here.
Have feedback on this article? Concerned about the content? Get in touch with us directly. Alternatively, email editorial-team (at) simplywallst.com.
This article by Simply Wall St is general in nature. We provide commentary based on historical data and analyst forecasts only using an unbiased methodology and our articles are not intended to be financial advice. It does not constitute a recommendation to buy or sell any stock, and does not take account of your objectives, or your financial situation. We aim to bring you long-term focused analysis driven by fundamental data. Note that our analysis may not factor in the latest price-sensitive company announcements or qualitative material. Simply Wall St has no position in any stocks mentioned.
