
 Yahoo Finance
 Loss-Making comScore, Inc. (NASDAQ:SCOR) Expected To Breakeven In The Medium-Term
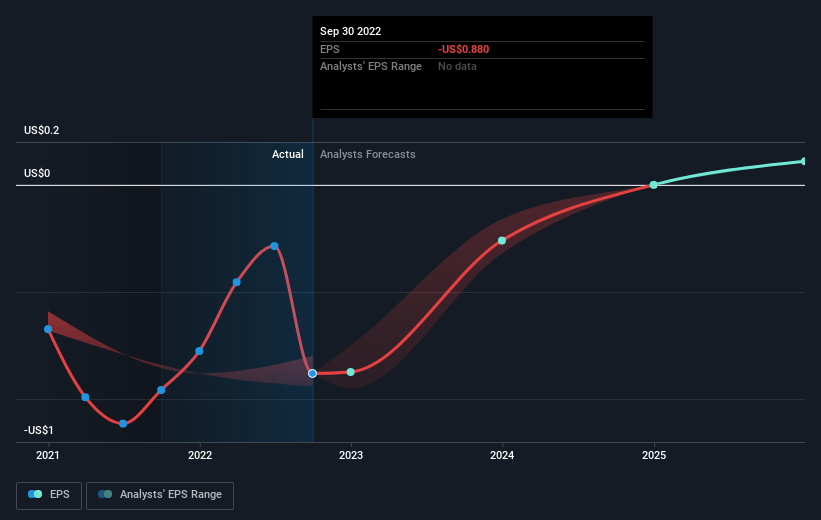
With the business potentially at an important milestone, we thought we'd take a closer look at comScore, Inc.'s (NASDAQ:SCOR) future prospects. comScore, Inc. operates as an information and analytics company that measures advertising, consumer behavior, and audiences across media platforms in the United States, Europe, Latin America, Canada, and internationally. The US$118m market-cap company posted a loss in its most recent financial year of US$63m and a latest trailing-twelve-month loss of US$79m leading to an even wider gap between loss and breakeven. The most pressing concern for investors is comScore's path to profitability – when will it breakeven? We've put together a brief outline of industry analyst expectations for the company, its year of breakeven and its implied growth rate.
See our latest analysis for comScore
According to the 4 industry analysts covering comScore, the consensus is that breakeven is near. They anticipate the company to incur a final loss in 2024, before generating positive profits of US$11m in 2025. So, the company is predicted to breakeven approximately 2 years from now. In order to meet this breakeven date, we calculated the rate at which the company must grow year-on-year. It turns out an average annual growth rate of 85% is expected, which is extremely buoyant. If this rate turns out to be too aggressive, the company may become profitable much later than analysts predict.
We're not going to go through company-specific developments for comScore given that this is a high-level summary, but, bear in mind that by and large a high growth rate is not out of the ordinary, particularly when a company is in a period of investment.
Before we wrap up, there’s one aspect worth mentioning. The company has managed its capital judiciously, with debt making up 4.9% of equity. This means that it has predominantly funded its operations from equity capital, and its low debt obligation reduces the risk around investing in the loss-making company.
Next Steps:
There are key fundamentals of comScore which are not covered in this article, but we must stress again that this is merely a basic overview. For a more comprehensive look at comScore, take a look at comScore's company page on Simply Wall St. We've also put together a list of pertinent factors you should further examine:
Valuation: What is comScore worth today? Has the future growth potential already been factored into the price? The intrinsic value infographic in our free research report helps visualize whether comScore is currently mispriced by the market.
Management Team: An experienced management team on the helm increases our confidence in the business – take a look at who sits on comScore’s board and the CEO’s background.
Other High-Performing Stocks: Are there other stocks that provide better prospects with proven track records? Explore our free list of these great stocks here.
Have feedback on this article? Concerned about the content? Get in touch with us directly. Alternatively, email editorial-team (at) simplywallst.com.
This article by Simply Wall St is general in nature. We provide commentary based on historical data and analyst forecasts only using an unbiased methodology and our articles are not intended to be financial advice. It does not constitute a recommendation to buy or sell any stock, and does not take account of your objectives, or your financial situation. We aim to bring you long-term focused analysis driven by fundamental data. Note that our analysis may not factor in the latest price-sensitive company announcements or qualitative material. Simply Wall St has no position in any stocks mentioned.
Join A Paid User Research Session
You’ll receive a US$30 Amazon Gift card for 1 hour of your time while helping us build better investing tools for the individual investors like yourself. Sign up here
