
 Yahoo Finance
 A Look Into Gravity's (NASDAQ:GRVY) Impressive Returns On Capital
If you're looking for a multi-bagger, there's a few things to keep an eye out for. In a perfect world, we'd like to see a company investing more capital into its business and ideally the returns earned from that capital are also increasing. Basically this means that a company has profitable initiatives that it can continue to reinvest in, which is a trait of a compounding machine. So, when we ran our eye over Gravity's (NASDAQ:GRVY) trend of ROCE, we really liked what we saw.
Return On Capital Employed (ROCE): What Is It?
Just to clarify if you're unsure, ROCE is a metric for evaluating how much pre-tax income (in percentage terms) a company earns on the capital invested in its business. Analysts use this formula to calculate it for Gravity:
Return on Capital Employed = Earnings Before Interest and Tax (EBIT) ÷ (Total Assets - Current Liabilities)
0.33 = ₩126b ÷ (₩474b - ₩97b) (Based on the trailing twelve months to March 2023).
Therefore, Gravity has an ROCE of 33%. In absolute terms that's a great return and it's even better than the Entertainment industry average of 12%.
See our latest analysis for Gravity
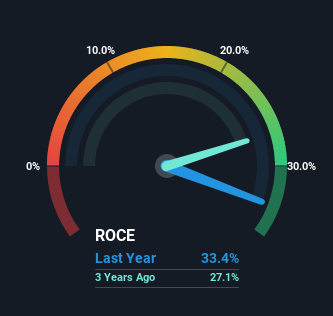
Historical performance is a great place to start when researching a stock so above you can see the gauge for Gravity's ROCE against it's prior returns. If you want to delve into the historical earnings, revenue and cash flow of Gravity, check out these free graphs here.
So How Is Gravity's ROCE Trending?
We'd be pretty happy with returns on capital like Gravity. The company has employed 594% more capital in the last five years, and the returns on that capital have remained stable at 33%. With returns that high, it's great that the business can continually reinvest its money at such appealing rates of return. If Gravity can keep this up, we'd be very optimistic about its future.
On a side note, Gravity has done well to reduce current liabilities to 20% of total assets over the last five years. Effectively suppliers now fund less of the business, which can lower some elements of risk.
What We Can Learn From Gravity's ROCE
In the end, the company has proven it can reinvest it's capital at high rates of returns, which you'll remember is a trait of a multi-bagger. And the stock has followed suit returning a meaningful 74% to shareholders over the last five years. So while investors seem to be recognizing these promising trends, we still believe the stock deserves further research.
While Gravity looks impressive, no company is worth an infinite price. The intrinsic value infographic in our free research report helps visualize whether GRVY is currently trading for a fair price.
High returns are a key ingredient to strong performance, so check out our free list ofstocks earning high returns on equity with solid balance sheets.
Have feedback on this article? Concerned about the content? Get in touch with us directly. Alternatively, email editorial-team (at) simplywallst.com.
This article by Simply Wall St is general in nature. We provide commentary based on historical data and analyst forecasts only using an unbiased methodology and our articles are not intended to be financial advice. It does not constitute a recommendation to buy or sell any stock, and does not take account of your objectives, or your financial situation. We aim to bring you long-term focused analysis driven by fundamental data. Note that our analysis may not factor in the latest price-sensitive company announcements or qualitative material. Simply Wall St has no position in any stocks mentioned.
Join A Paid User Research Session
You’ll receive a US$30 Amazon Gift card for 1 hour of your time while helping us build better investing tools for the individual investors like yourself. Sign up here
