
 Yahoo Finance
 A Look Into Donaldson Company's (NYSE:DCI) Impressive Returns On Capital
If we want to find a potential multi-bagger, often there are underlying trends that can provide clues. Typically, we'll want to notice a trend of growing return on capital employed (ROCE) and alongside that, an expanding base of capital employed. This shows us that it's a compounding machine, able to continually reinvest its earnings back into the business and generate higher returns. That's why when we briefly looked at Donaldson Company's (NYSE:DCI) ROCE trend, we were very happy with what we saw.
Return On Capital Employed (ROCE): What is it?
If you haven't worked with ROCE before, it measures the 'return' (pre-tax profit) a company generates from capital employed in its business. The formula for this calculation on Donaldson Company is:
Return on Capital Employed = Earnings Before Interest and Tax (EBIT) ÷ (Total Assets - Current Liabilities)
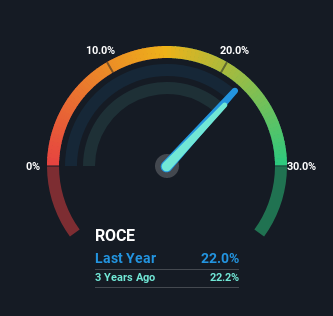
0.22 = US$421m ÷ (US$2.5b - US$607m) (Based on the trailing twelve months to April 2022).
So, Donaldson Company has an ROCE of 22%. That's a fantastic return and not only that, it outpaces the average of 9.8% earned by companies in a similar industry.
Check out our latest analysis for Donaldson Company
Above you can see how the current ROCE for Donaldson Company compares to its prior returns on capital, but there's only so much you can tell from the past. If you'd like to see what analysts are forecasting going forward, you should check out our free report for Donaldson Company.
What Can We Tell From Donaldson Company's ROCE Trend?
It's hard not to be impressed by Donaldson Company's returns on capital. The company has consistently earned 22% for the last five years, and the capital employed within the business has risen 56% in that time. With returns that high, it's great that the business can continually reinvest its money at such appealing rates of return. You'll see this when looking at well operated businesses or favorable business models.
One more thing to note, even though ROCE has remained relatively flat over the last five years, the reduction in current liabilities to 24% of total assets, is good to see from a business owner's perspective. This can eliminate some of the risks inherent in the operations because the business has less outstanding obligations to their suppliers and or short-term creditors than they did previously.
Our Take On Donaldson Company's ROCE
In short, we'd argue Donaldson Company has the makings of a multi-bagger since its been able to compound its capital at very profitable rates of return. In light of this, the stock has only gained 18% over the last five years for shareholders who have owned the stock in this period. So because of the trends we're seeing, we'd recommend looking further into this stock to see if it has the makings of a multi-bagger.
One more thing to note, we've identified 1 warning sign with Donaldson Company and understanding this should be part of your investment process.
If you want to search for more stocks that have been earning high returns, check out this free list of stocks with solid balance sheets that are also earning high returns on equity.
Have feedback on this article? Concerned about the content? Get in touch with us directly. Alternatively, email editorial-team (at) simplywallst.com.
This article by Simply Wall St is general in nature. We provide commentary based on historical data and analyst forecasts only using an unbiased methodology and our articles are not intended to be financial advice. It does not constitute a recommendation to buy or sell any stock, and does not take account of your objectives, or your financial situation. We aim to bring you long-term focused analysis driven by fundamental data. Note that our analysis may not factor in the latest price-sensitive company announcements or qualitative material. Simply Wall St has no position in any stocks mentioned.
Join A Paid User Research Session
You’ll receive a US$30 Amazon Gift card for 1 hour of your time while helping us build better investing tools for the individual investors like yourself. Sign up here
