
 Yahoo Finance
 Is Liquidity Services, Inc.’s (NASDAQ:LQDT) CEO Salary Justified?

Bill Angrick became the CEO of Liquidity Services, Inc. (NASDAQ:LQDT) in 2000. First, this article will compare CEO compensation with compensation at similar sized companies. Next, we’ll consider growth that the business demonstrates. Third, we’ll reflect on the total return to shareholders over three years, as a second measure of business performance. This method should give us information to assess how appropriately the company pays the CEO.
Check out our latest analysis for Liquidity Services
How Does Bill Angrick’s Compensation Compare With Similar Sized Companies?
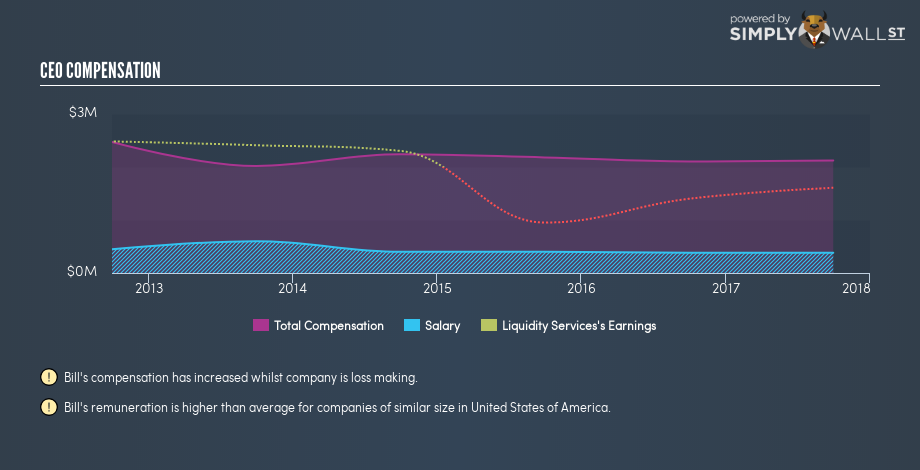
According to our data, Liquidity Services, Inc. has a market capitalization of US$237m, and pays its CEO total annual compensation worth US$2.1m. (This number is for the twelve months until 2017). We think total compensation is more important but we note that the CEO salary is lower, at US$380k. We examined companies with market caps from US$100m to US$400m, and discovered that the median CEO compensation of that group was US$958k.
Thus we can conclude that Bill Angrick receives more in total compensation than the median of a group of companies in the same market, and of similar size to Liquidity Services, Inc.. However, this doesn’t necessarily mean the pay is too high. We can get a better idea of how generous the pay is by looking at the performance of the underlying business.
The graphic below shows how CEO compensation at Liquidity Services has changed from year to year.
Is Liquidity Services, Inc. Growing?
Over the last three years Liquidity Services, Inc. has grown its earnings per share (EPS) by an average of 37% per year. In the last year, its revenue is down -17%.
This demonstrates that the company has been improving recently. A good result. While it would be good to see revenue growth, profits matter more in the end.
Shareholders might be interested in this free visualization of analyst forecasts. .
Has Liquidity Services, Inc. Been A Good Investment?
Liquidity Services, Inc. has generated a total shareholder return of 11% over three years, so most shareholders would be reasonably content. But they probably don’t want to see the CEO paid more than is normal for companies around the same size.
In Summary…
We compared total CEO remuneration at Liquidity Services, Inc. with the amount paid at companies with a similar market capitalization. Our data suggests that it pays above the median CEO pay within that group.
However we must not forget that the EPS growth has been very strong over three years. We also note that, over the same time frame, shareholder returns haven’t been bad. While it may be worth researching further, we don’t see a problem with the CEO pay, given the good EPS growth. So you may want to check if insiders are buying Liquidity Services shares with their own money (free access).
Or you might prefer examine intently this intuitive graph showing past earnings and revenue.
To help readers see past the short term volatility of the financial market, we aim to bring you a long-term focused research analysis purely driven by fundamental data. Note that our analysis does not factor in the latest price-sensitive company announcements.
The author is an independent contributor and at the time of publication had no position in the stocks mentioned. For errors that warrant correction please contact the editor at editorial-team@simplywallst.com.
