
 Yahoo Finance
 Is Legend Corporation Limited’s (ASX:LGD) Balance Sheet Strong Enough To Weather A Storm?

Legend Corporation Limited (ASX:LGD) is a small-cap stock with a market capitalization of AU$58.5m. While investors primarily focus on the growth potential and competitive landscape of the small-cap companies, they end up ignoring a key aspect, which could be the biggest threat to its existence: its financial health. Why is it important? Evaluating financial health as part of your investment thesis is crucial, since poor capital management may bring about bankruptcies, which occur at a higher rate for small-caps. Here are a few basic checks that are good enough to have a broad overview of the company’s financial strength. Nevertheless, this commentary is still very high-level, so I suggest you dig deeper yourself into LGD here.
How does LGD’s operating cash flow stack up against its debt?
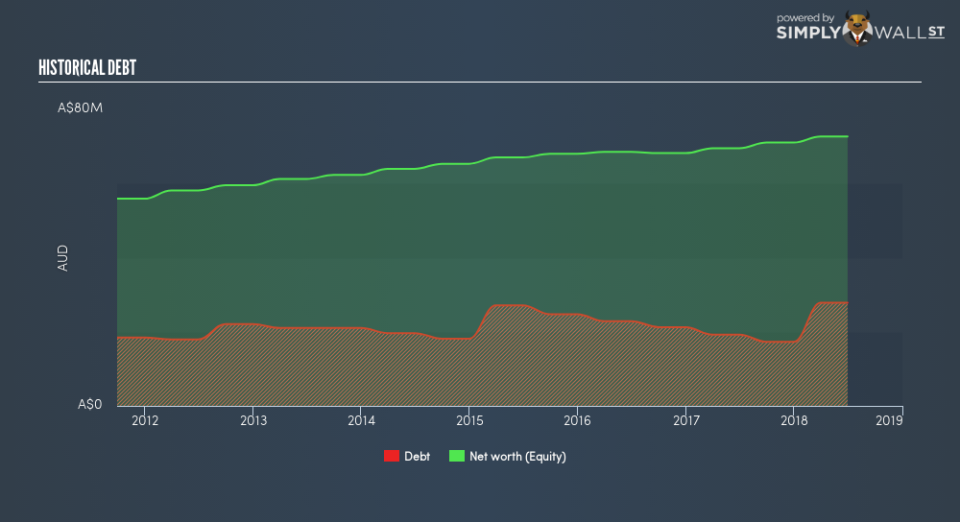
LGD has built up its total debt levels in the last twelve months, from AU$19.2m to AU$27.8m , which comprises of short- and long-term debt. With this rise in debt, LGD currently has AU$6.7m remaining in cash and short-term investments , ready to deploy into the business. Additionally, LGD has generated AU$6.5m in operating cash flow in the last twelve months, leading to an operating cash to total debt ratio of 23.4%, signalling that LGD’s current level of operating cash is high enough to cover debt. This ratio can also be a sign of operational efficiency as an alternative to return on assets. In LGD’s case, it is able to generate 0.23x cash from its debt capital.
Can LGD pay its short-term liabilities?
With current liabilities at AU$34.9m, it appears that the company has maintained a safe level of current assets to meet its obligations, with the current ratio last standing at 1.99x. Generally, for Trade Distributors companies, this is a reasonable ratio since there’s sufficient cash cushion without leaving too much capital idle or in low-earning investments.
Does LGD face the risk of succumbing to its debt-load?
LGD’s level of debt is appropriate relative to its total equity, at 38.3%. LGD is not taking on too much debt commitment, which can be restrictive and risky for equity-holders. We can test if LGD’s debt levels are sustainable by measuring interest payments against earnings of a company. Ideally, earnings before interest and tax (EBIT) should cover net interest by at least three times. For LGD, the ratio of 8.9x suggests that interest is appropriately covered, which means that lenders may be inclined to lend more money to the company, as it is seen as safe in terms of payback.
Next Steps:
LGD’s low debt is also met with low coverage. This indicates room for improvement as its cash flow covers less than a quarter of its borrowings, which means its operating efficiency could be better. However, the company will be able to pay all of its upcoming liabilities from its current short-term assets. This is only a rough assessment of financial health, and I’m sure LGD has company-specific issues impacting its capital structure decisions. I suggest you continue to research Legend to get a more holistic view of the stock by looking at:
Future Outlook: What are well-informed industry analysts predicting for LGD’s future growth? Take a look at our free research report of analyst consensus for LGD’s outlook.
Valuation: What is LGD worth today? Is the stock undervalued, even when its growth outlook is factored into its intrinsic value? The intrinsic value infographic in our free research report helps visualize whether LGD is currently mispriced by the market.
Other High-Performing Stocks: Are there other stocks that provide better prospects with proven track records? Explore our free list of these great stocks here.
To help readers see past the short term volatility of the financial market, we aim to bring you a long-term focused research analysis purely driven by fundamental data. Note that our analysis does not factor in the latest price-sensitive company announcements.
The author is an independent contributor and at the time of publication had no position in the stocks mentioned. For errors that warrant correction please contact the editor at editorial-team@simplywallst.com.
