
 Yahoo Finance
 Will Lefroy Exploration (ASX:LEX) Spend Its Cash Wisely?
Even when a business is losing money, it's possible for shareholders to make money if they buy a good business at the right price. For example, although Amazon.com made losses for many years after listing, if you had bought and held the shares since 1999, you would have made a fortune. But while history lauds those rare successes, those that fail are often forgotten; who remembers Pets.com?
Given this risk, we thought we'd take a look at whether Lefroy Exploration (ASX:LEX) shareholders should be worried about its cash burn. For the purposes of this article, cash burn is the annual rate at which an unprofitable company spends cash to fund its growth; its negative free cash flow. The first step is to compare its cash burn with its cash reserves, to give us its 'cash runway'.
View our latest analysis for Lefroy Exploration
Does Lefroy Exploration Have A Long Cash Runway?
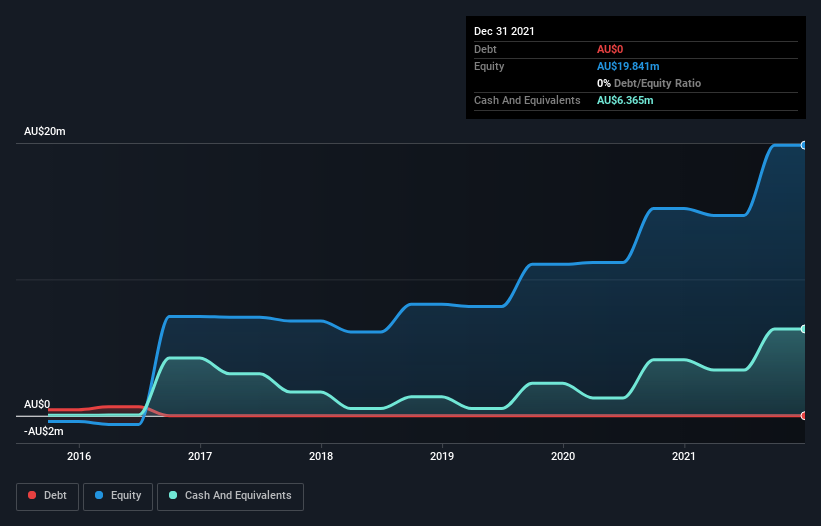
A company's cash runway is the amount of time it would take to burn through its cash reserves at its current cash burn rate. When Lefroy Exploration last reported its balance sheet in December 2021, it had zero debt and cash worth AU$6.4m. Importantly, its cash burn was AU$5.2m over the trailing twelve months. So it had a cash runway of approximately 15 months from December 2021. That's not too bad, but it's fair to say the end of the cash runway is in sight, unless cash burn reduces drastically. The image below shows how its cash balance has been changing over the last few years.
How Is Lefroy Exploration's Cash Burn Changing Over Time?
Lefroy Exploration didn't record any revenue over the last year, indicating that it's an early stage company still developing its business. Nonetheless, we can still examine its cash burn trajectory as part of our assessment of its cash burn situation. Over the last year its cash burn actually increased by a very significant 75%. While this spending increase is no doubt intended to drive growth, if the trend continues the company's cash runway will shrink very quickly. Admittedly, we're a bit cautious of Lefroy Exploration due to its lack of significant operating revenues. We prefer most of the stocks on this list of stocks that analysts expect to grow.
Can Lefroy Exploration Raise More Cash Easily?
While Lefroy Exploration does have a solid cash runway, its cash burn trajectory may have some shareholders thinking ahead to when the company may need to raise more cash. Companies can raise capital through either debt or equity. Commonly, a business will sell new shares in itself to raise cash and drive growth. We can compare a company's cash burn to its market capitalisation to get a sense for how many new shares a company would have to issue to fund one year's operations.
Since it has a market capitalisation of AU$41m, Lefroy Exploration's AU$5.2m in cash burn equates to about 13% of its market value. Given that situation, it's fair to say the company wouldn't have much trouble raising more cash for growth, but shareholders would be somewhat diluted.
So, Should We Worry About Lefroy Exploration's Cash Burn?
On this analysis of Lefroy Exploration's cash burn, we think its cash burn relative to its market cap was reassuring, while its increasing cash burn has us a bit worried. We don't think its cash burn is particularly problematic, but after considering the range of factors in this article, we do think shareholders should be monitoring how it changes over time. Taking a deeper dive, we've spotted 5 warning signs for Lefroy Exploration you should be aware of, and 3 of them are significant.
If you would prefer to check out another company with better fundamentals, then do not miss this free list of interesting companies, that have HIGH return on equity and low debt or this list of stocks which are all forecast to grow.
Have feedback on this article? Concerned about the content? Get in touch with us directly. Alternatively, email editorial-team (at) simplywallst.com.
This article by Simply Wall St is general in nature. We provide commentary based on historical data and analyst forecasts only using an unbiased methodology and our articles are not intended to be financial advice. It does not constitute a recommendation to buy or sell any stock, and does not take account of your objectives, or your financial situation. We aim to bring you long-term focused analysis driven by fundamental data. Note that our analysis may not factor in the latest price-sensitive company announcements or qualitative material. Simply Wall St has no position in any stocks mentioned.
Join A Paid User Research Session
You’ll receive a US$30 Amazon Gift card for 1 hour of your time while helping us build better investing tools for the individual investors like yourself. Sign up here
