
 Yahoo Finance
 What You Can Learn From Pop Culture Group Co., Ltd's (NASDAQ:CPOP) P/E
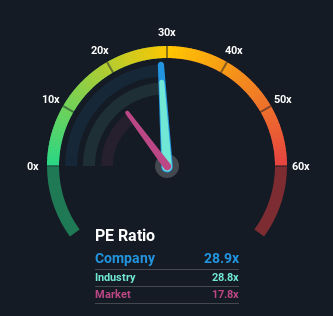
Pop Culture Group Co., Ltd's (NASDAQ:CPOP) price-to-earnings (or "P/E") ratio of 28.9x might make it look like a strong sell right now compared to the market in the United States, where around half of the companies have P/E ratios below 17x and even P/E's below 10x are quite common. Nonetheless, we'd need to dig a little deeper to determine if there is a rational basis for the highly elevated P/E.
For instance, Pop Culture Group's receding earnings in recent times would have to be some food for thought. It might be that many expect the company to still outplay most other companies over the coming period, which has kept the P/E from collapsing. If not, then existing shareholders may be quite nervous about the viability of the share price.
View our latest analysis for Pop Culture Group
Although there are no analyst estimates available for Pop Culture Group, take a look at this free data-rich visualisation to see how the company stacks up on earnings, revenue and cash flow.
How Is Pop Culture Group's Growth Trending?
The only time you'd be truly comfortable seeing a P/E as steep as Pop Culture Group's is when the company's growth is on track to outshine the market decidedly.
Retrospectively, the last year delivered a frustrating 52% decrease to the company's bottom line. Still, the latest three year period has seen an excellent 302% overall rise in EPS, in spite of its unsatisfying short-term performance. So we can start by confirming that the company has generally done a very good job of growing earnings over that time, even though it had some hiccups along the way.
Comparing that to the market, which is only predicted to deliver 12% growth in the next 12 months, the company's momentum is stronger based on recent medium-term annualised earnings results.
With this information, we can see why Pop Culture Group is trading at such a high P/E compared to the market. Presumably shareholders aren't keen to offload something they believe will continue to outmanoeuvre the bourse.
What We Can Learn From Pop Culture Group's P/E?
We'd say the price-to-earnings ratio's power isn't primarily as a valuation instrument but rather to gauge current investor sentiment and future expectations.
We've established that Pop Culture Group maintains its high P/E on the strength of its recent three-year growth being higher than the wider market forecast, as expected. At this stage investors feel the potential for a deterioration in earnings isn't great enough to justify a lower P/E ratio. Unless the recent medium-term conditions change, they will continue to provide strong support to the share price.
Don't forget that there may be other risks. For instance, we've identified 4 warning signs for Pop Culture Group (1 makes us a bit uncomfortable) you should be aware of.
It's important to make sure you look for a great company, not just the first idea you come across. So take a peek at this free list of interesting companies with strong recent earnings growth (and a P/E ratio below 20x).
This article by Simply Wall St is general in nature. We provide commentary based on historical data and analyst forecasts only using an unbiased methodology and our articles are not intended to be financial advice. It does not constitute a recommendation to buy or sell any stock, and does not take account of your objectives, or your financial situation. We aim to bring you long-term focused analysis driven by fundamental data. Note that our analysis may not factor in the latest price-sensitive company announcements or qualitative material. Simply Wall St has no position in any stocks mentioned.
Have feedback on this article? Concerned about the content? Get in touch with us directly. Alternatively, email editorial-team (at) simplywallst.com.
