
 Yahoo Finance
 Kontron (ETR:SANT) Has Some Way To Go To Become A Multi-Bagger
There are a few key trends to look for if we want to identify the next multi-bagger. Firstly, we'd want to identify a growing return on capital employed (ROCE) and then alongside that, an ever-increasing base of capital employed. If you see this, it typically means it's a company with a great business model and plenty of profitable reinvestment opportunities. Having said that, from a first glance at Kontron (ETR:SANT) we aren't jumping out of our chairs at how returns are trending, but let's have a deeper look.
What Is Return On Capital Employed (ROCE)?
For those that aren't sure what ROCE is, it measures the amount of pre-tax profits a company can generate from the capital employed in its business. Analysts use this formula to calculate it for Kontron:
Return on Capital Employed = Earnings Before Interest and Tax (EBIT) ÷ (Total Assets - Current Liabilities)
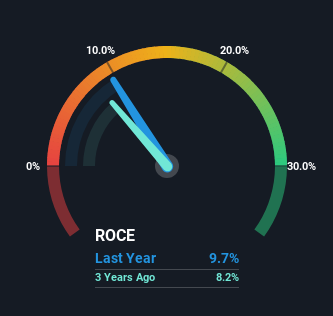
0.097 = €72m ÷ (€1.4b - €631m) (Based on the trailing twelve months to December 2023).
Therefore, Kontron has an ROCE of 9.7%. Even though it's in line with the industry average of 9.7%, it's still a low return by itself.
See our latest analysis for Kontron
In the above chart we have measured Kontron's prior ROCE against its prior performance, but the future is arguably more important. If you'd like to see what analysts are forecasting going forward, you should check out our free analyst report for Kontron .
So How Is Kontron's ROCE Trending?
There are better returns on capital out there than what we're seeing at Kontron. The company has employed 48% more capital in the last five years, and the returns on that capital have remained stable at 9.7%. Given the company has increased the amount of capital employed, it appears the investments that have been made simply don't provide a high return on capital.
On a side note, Kontron's current liabilities are still rather high at 46% of total assets. This can bring about some risks because the company is basically operating with a rather large reliance on its suppliers or other sorts of short-term creditors. While it's not necessarily a bad thing, it can be beneficial if this ratio is lower.
The Key Takeaway
As we've seen above, Kontron's returns on capital haven't increased but it is reinvesting in the business. Additionally, the stock's total return to shareholders over the last five years has been flat, which isn't too surprising. Therefore based on the analysis done in this article, we don't think Kontron has the makings of a multi-bagger.
On a separate note, we've found 1 warning sign for Kontron you'll probably want to know about.
For those who like to invest in solid companies, check out this free list of companies with solid balance sheets and high returns on equity.
Have feedback on this article? Concerned about the content? Get in touch with us directly. Alternatively, email editorial-team (at) simplywallst.com.
This article by Simply Wall St is general in nature. We provide commentary based on historical data and analyst forecasts only using an unbiased methodology and our articles are not intended to be financial advice. It does not constitute a recommendation to buy or sell any stock, and does not take account of your objectives, or your financial situation. We aim to bring you long-term focused analysis driven by fundamental data. Note that our analysis may not factor in the latest price-sensitive company announcements or qualitative material. Simply Wall St has no position in any stocks mentioned.
