
 Yahoo Finance
 Do You Know About Medialink Group Limited’s (HKG:2230) ROCE?

Today we are going to look at Medialink Group Limited (HKG:2230) to see whether it might be an attractive investment prospect. Specifically, we'll consider its Return On Capital Employed (ROCE), since that will give us an insight into how efficiently the business can generate profits from the capital it requires.
Firstly, we'll go over how we calculate ROCE. Then we'll compare its ROCE to similar companies. Finally, we'll look at how its current liabilities affect its ROCE.
What is Return On Capital Employed (ROCE)?
ROCE is a measure of a company's yearly pre-tax profit (its return), relative to the capital employed in the business. All else being equal, a better business will have a higher ROCE. In brief, it is a useful tool, but it is not without drawbacks. Renowned investment researcher Michael Mauboussin has suggested that a high ROCE can indicate that 'one dollar invested in the company generates value of more than one dollar'.
So, How Do We Calculate ROCE?
The formula for calculating the return on capital employed is:
Return on Capital Employed = Earnings Before Interest and Tax (EBIT) ÷ (Total Assets - Current Liabilities)
Or for Medialink Group:
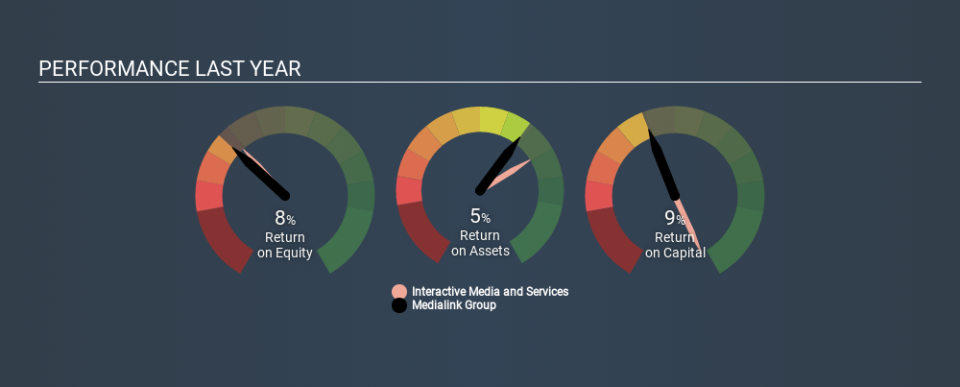
0.094 = HK$45m ÷ (HK$696m - HK$218m) (Based on the trailing twelve months to September 2019.)
Therefore, Medialink Group has an ROCE of 9.4%.
See our latest analysis for Medialink Group
Is Medialink Group's ROCE Good?
ROCE is commonly used for comparing the performance of similar businesses. It appears that Medialink Group's ROCE is fairly close to the Interactive Media and Services industry average of 12%. Separate from how Medialink Group stacks up against its industry, its ROCE in absolute terms is mediocre; relative to the returns on government bonds. Investors may wish to consider higher-performing investments.
We can see that, Medialink Group currently has an ROCE of 9.4%, less than the 41% it reported 3 years ago. This makes us wonder if the business is facing new challenges. You can see in the image below how Medialink Group's ROCE compares to its industry. Click to see more on past growth.
When considering this metric, keep in mind that it is backwards looking, and not necessarily predictive. ROCE can be misleading for companies in cyclical industries, with returns looking impressive during the boom times, but very weak during the busts. This is because ROCE only looks at one year, instead of considering returns across a whole cycle. If Medialink Group is cyclical, it could make sense to check out this free graph of past earnings, revenue and cash flow.
What Are Current Liabilities, And How Do They Affect Medialink Group's ROCE?
Short term (or current) liabilities, are things like supplier invoices, overdrafts, or tax bills that need to be paid within 12 months. Due to the way ROCE is calculated, a high level of current liabilities makes a company look as though it has less capital employed, and thus can (sometimes unfairly) boost the ROCE. To counteract this, we check if a company has high current liabilities, relative to its total assets.
Medialink Group has current liabilities of HK$218m and total assets of HK$696m. As a result, its current liabilities are equal to approximately 31% of its total assets. Medialink Group's ROCE is improved somewhat by its moderate amount of current liabilities.
The Bottom Line On Medialink Group's ROCE
Despite this, its ROCE is still mediocre, and you may find more appealing investments elsewhere. Of course, you might find a fantastic investment by looking at a few good candidates. So take a peek at this free list of companies with modest (or no) debt, trading on a P/E below 20.
If you like to buy stocks alongside management, then you might just love this free list of companies. (Hint: insiders have been buying them).
If you spot an error that warrants correction, please contact the editor at editorial-team@simplywallst.com. This article by Simply Wall St is general in nature. It does not constitute a recommendation to buy or sell any stock, and does not take account of your objectives, or your financial situation. Simply Wall St has no position in the stocks mentioned.
We aim to bring you long-term focused research analysis driven by fundamental data. Note that our analysis may not factor in the latest price-sensitive company announcements or qualitative material. Thank you for reading.
