
 Yahoo Finance
 All You Need To Know About ICU Medical, Inc.'s (NASDAQ:ICUI) Financial Health

Want to participate in a short research study? Help shape the future of investing tools and you could win a $250 gift card!
Small-caps and large-caps are wildly popular among investors, however, mid-cap stocks, such as ICU Medical, Inc. (NASDAQ:ICUI), with a market capitalization of US$4.4b, rarely draw their attention from the investing community. Despite this, commonly overlooked mid-caps have historically produced better risk-adjusted returns than their small and large-cap counterparts. ICUI’s financial liquidity and debt position will be analysed in this article, to get an idea of whether the company can fund opportunities for strategic growth and maintain strength through economic downturns. Note that this commentary is very high-level and solely focused on financial health, so I suggest you dig deeper yourself into ICUI here.
Check out our latest analysis for ICU Medical
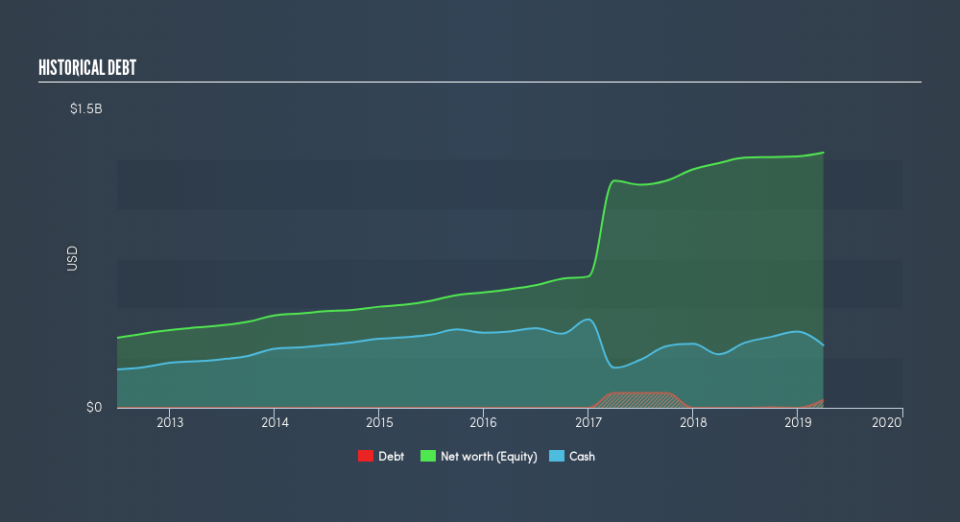
ICUI’s Debt (And Cash Flows)
ICUI has increased its debt level by about US$39m over the last 12 months – which includes long-term debt. With this ramp up in debt, ICUI currently has US$314m remaining in cash and short-term investments , ready to be used for running the business. On top of this, ICUI has produced cash from operations of US$160m during the same period of time, leading to an operating cash to total debt ratio of 414%, meaning that ICUI’s operating cash is sufficient to cover its debt.
Does ICUI’s liquid assets cover its short-term commitments?
Looking at ICUI’s US$238m in current liabilities, the company has maintained a safe level of current assets to meet its obligations, with the current ratio last standing at 3.86x. The current ratio is calculated by dividing current assets by current liabilities. Having said that, a ratio greater than 3x may be considered by some to be quite high, however this is not necessarily a negative for the company.
Is ICUI’s debt level acceptable?
With a debt-to-equity ratio of 3.0%, ICUI's debt level is relatively low. This range is considered safe as ICUI is not taking on too much debt obligation, which may be constraining for future growth.
Next Steps:
ICUI has demonstrated its ability to generate sufficient levels of cash flow, while its debt hovers at a safe level. In addition to this, the company exhibits an ability to meet its near term obligations should an adverse event occur. This is only a rough assessment of financial health, and I'm sure ICUI has company-specific issues impacting its capital structure decisions. I recommend you continue to research ICU Medical to get a more holistic view of the stock by looking at:
Future Outlook: What are well-informed industry analysts predicting for ICUI’s future growth? Take a look at our free research report of analyst consensus for ICUI’s outlook.
Valuation: What is ICUI worth today? Is the stock undervalued, even when its growth outlook is factored into its intrinsic value? The intrinsic value infographic in our free research report helps visualize whether ICUI is currently mispriced by the market.
Other High-Performing Stocks: Are there other stocks that provide better prospects with proven track records? Explore our free list of these great stocks here.
We aim to bring you long-term focused research analysis driven by fundamental data. Note that our analysis may not factor in the latest price-sensitive company announcements or qualitative material.
If you spot an error that warrants correction, please contact the editor at editorial-team@simplywallst.com. This article by Simply Wall St is general in nature. It does not constitute a recommendation to buy or sell any stock, and does not take account of your objectives, or your financial situation. Simply Wall St has no position in the stocks mentioned. Thank you for reading.