
 Yahoo Finance
 Do You Know What Elders Limited's (ASX:ELD) P/E Ratio Means?

This article is written for those who want to get better at using price to earnings ratios (P/E ratios). To keep it practical, we'll show how Elders Limited's (ASX:ELD) P/E ratio could help you assess the value on offer. Looking at earnings over the last twelve months, Elders has a P/E ratio of 13.27. That is equivalent to an earnings yield of about 7.5%.
See our latest analysis for Elders
How Do I Calculate A Price To Earnings Ratio?
The formula for P/E is:
Price to Earnings Ratio = Share Price ÷ Earnings per Share (EPS)
Or for Elders:
P/E of 13.27 = A$6.83 ÷ A$0.51 (Based on the year to March 2019.)
Is A High P/E Ratio Good?
A higher P/E ratio means that investors are paying a higher price for each A$1 of company earnings. All else being equal, it's better to pay a low price -- but as Warren Buffett said, 'It's far better to buy a wonderful company at a fair price than a fair company at a wonderful price.'
Does Elders Have A Relatively High Or Low P/E For Its Industry?
One good way to get a quick read on what market participants expect of a company is to look at its P/E ratio. If you look at the image below, you can see Elders has a lower P/E than the average (15.5) in the food industry classification.
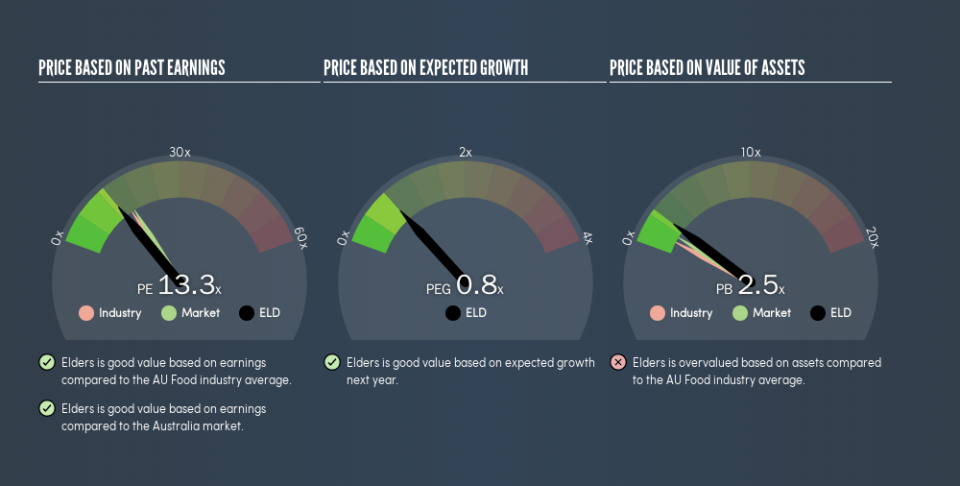
Elders's P/E tells us that market participants think it will not fare as well as its peers in the same industry. Since the market seems unimpressed with Elders, it's quite possible it could surprise on the upside. You should delve deeper. I like to check if company insiders have been buying or selling.
How Growth Rates Impact P/E Ratios
When earnings fall, the 'E' decreases, over time. Therefore, even if you pay a low multiple of earnings now, that multiple will become higher in the future. A higher P/E should indicate the stock is expensive relative to others -- and that may encourage shareholders to sell.
Elders shrunk earnings per share by 51% over the last year. And EPS is down 2.8% a year, over the last 3 years. This might lead to low expectations.
A Limitation: P/E Ratios Ignore Debt and Cash In The Bank
The 'Price' in P/E reflects the market capitalization of the company. That means it doesn't take debt or cash into account. Hypothetically, a company could reduce its future P/E ratio by spending its cash (or taking on debt) to achieve higher earnings.
Spending on growth might be good or bad a few years later, but the point is that the P/E ratio does not account for the option (or lack thereof).
Elders's Balance Sheet
Net debt totals 21% of Elders's market cap. It would probably deserve a higher P/E ratio if it was net cash, since it would have more options for growth.
The Verdict On Elders's P/E Ratio
Elders has a P/E of 13.3. That's below the average in the AU market, which is 16.3. With only modest debt, it's likely the lack of EPS growth at least partially explains the pessimism implied by the P/E ratio.
Investors have an opportunity when market expectations about a stock are wrong. As value investor Benjamin Graham famously said, 'In the short run, the market is a voting machine but in the long run, it is a weighing machine.' So this free visualization of the analyst consensus on future earnings could help you make the right decision about whether to buy, sell, or hold.
Of course, you might find a fantastic investment by looking at a few good candidates. So take a peek at this free list of companies with modest (or no) debt, trading on a P/E below 20.
We aim to bring you long-term focused research analysis driven by fundamental data. Note that our analysis may not factor in the latest price-sensitive company announcements or qualitative material.
If you spot an error that warrants correction, please contact the editor at editorial-team@simplywallst.com. This article by Simply Wall St is general in nature. It does not constitute a recommendation to buy or sell any stock, and does not take account of your objectives, or your financial situation. Simply Wall St has no position in the stocks mentioned. Thank you for reading.
